
.jpg)
September 2026 Calgary Real Estate Statistics Recap
Calgary’s housing market remained relatively stable in September, with 1,650 sales recorded across the city. Sales were similar to August and nearly 4% lower than September 2025, although stronger activity in the detached segment helped offset the typical seasonal slowdown. New listings increased from August, bringing the sales-to-new-listings ratio down to 49% and keeping inventory levels relatively steady. .jpg)
According to CREB® Chief Economist Ann-Marie Lurie, the differences across Calgary’s housing market are largely connected to where new supply has been added. Higher-density housing has seen the largest increase in construction and inventory, particularly for apartment and row-style homes. Meanwhile, detached construction has not increased at the same pace, allowing demand to absorb more of the available supply and keeping conditions more balanced.
Inventory levels remained just under four months of supply in September, with conditions continuing to vary significantly by property type:
- Detached homes: balanced market conditions, supported by stronger sales and limited supply growth
- Apartment-style homes: buyer-favouring conditions as elevated supply continues to weigh on demand
- Row homes: higher inventory levels are also contributing to more buyer-friendly conditions
As Calgary’s market moves further into fall, some monthly price declines are expected due to seasonal factors. The total residential benchmark price was $566,700 in September, nearly 1% lower than September 2025. However, seasonally adjusted prices remained relatively stable compared to August.
Most of the year-over-year price adjustments continued to occur in higher-density housing. Apartment and row-style homes recorded declines of approximately 9% and 6%, respectively, while detached home prices were only 1% lower than last year. The decline in detached prices was primarily concentrated in the North East, East and North districts.
Overall, Calgary’s housing market continues to show a clear divide between property types. Detached homes are benefiting from stronger demand and more limited supply, while apartment and row-style properties are facing greater inventory levels and more buyer-favouring conditions.
Latest Combined Calgary Real Estate Statistics: September 2026
Latest Combined Calgary Real Estate Statistics: September 2026
- Benchmark Price $566,700
- Inventory 6,486
- Sales to New Listings Ratio 49%
- Months of Inventory/Supply 3.93 Months of supply (Down 3% Y/Y)
Year to Date Calgary Real Estate Statistics: September 2026
- Benchmark Price $565,844
- Sales to New Listings Ratio 53%
- Months of Inventory/Supply 3.30 Months of supply (Up 13% Y/Y)
DOM = Number of Days on Market
As of Oct 6th 2026, the average number of days on market for all property types combined was 39 days (YTD) while the month of September saw an average DOM of 44
MLS® Listings in Calgary (New)
As of Oct 6th 2026, the total number of new active listings in the city of Calgary added to the market was 3,360 and in total there have been 31,309 YTD
Homes Sold in Calgary September 2026
The total number of homes sold for the month of September in Calgary was 1,650 this represents a 10.68% decrease Y/Y. The total sales for 2026 are 16.542
Average Real Estate Prices in Calgary
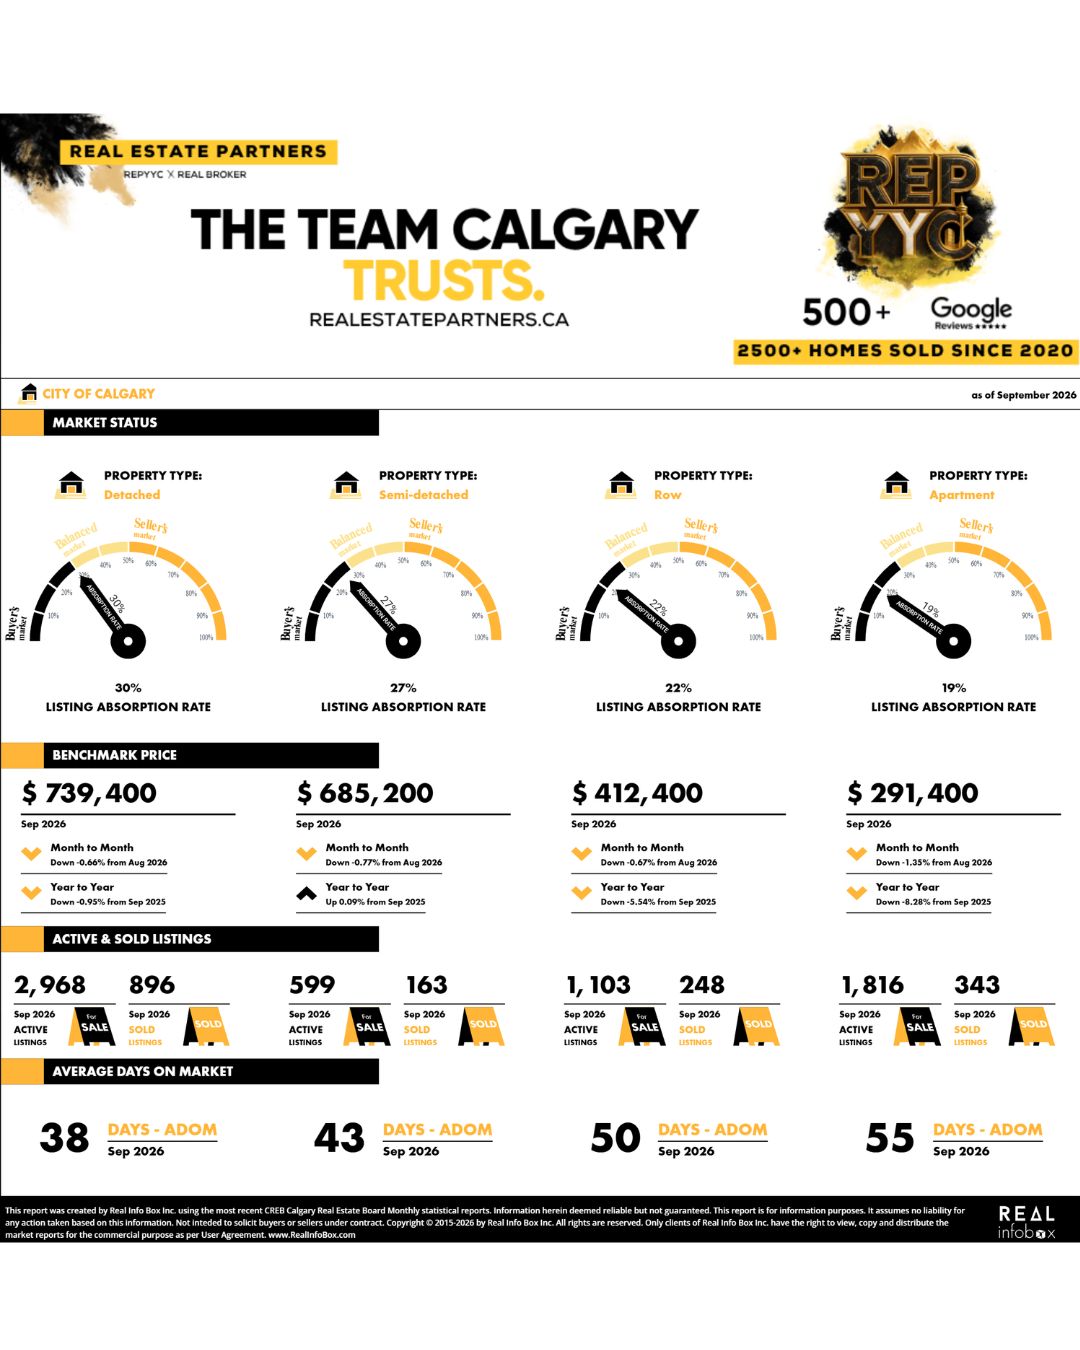
In September 2026 the average price for a detached home in the city of Calgary was $823,483
Free Calgary Real Estate Monthly Market Report
If you're looking for the latest sales and statistics for your community in Calgary or one that you're interested in moving to, please fill out the form below and let us know which community you need a monthly market report set up for.
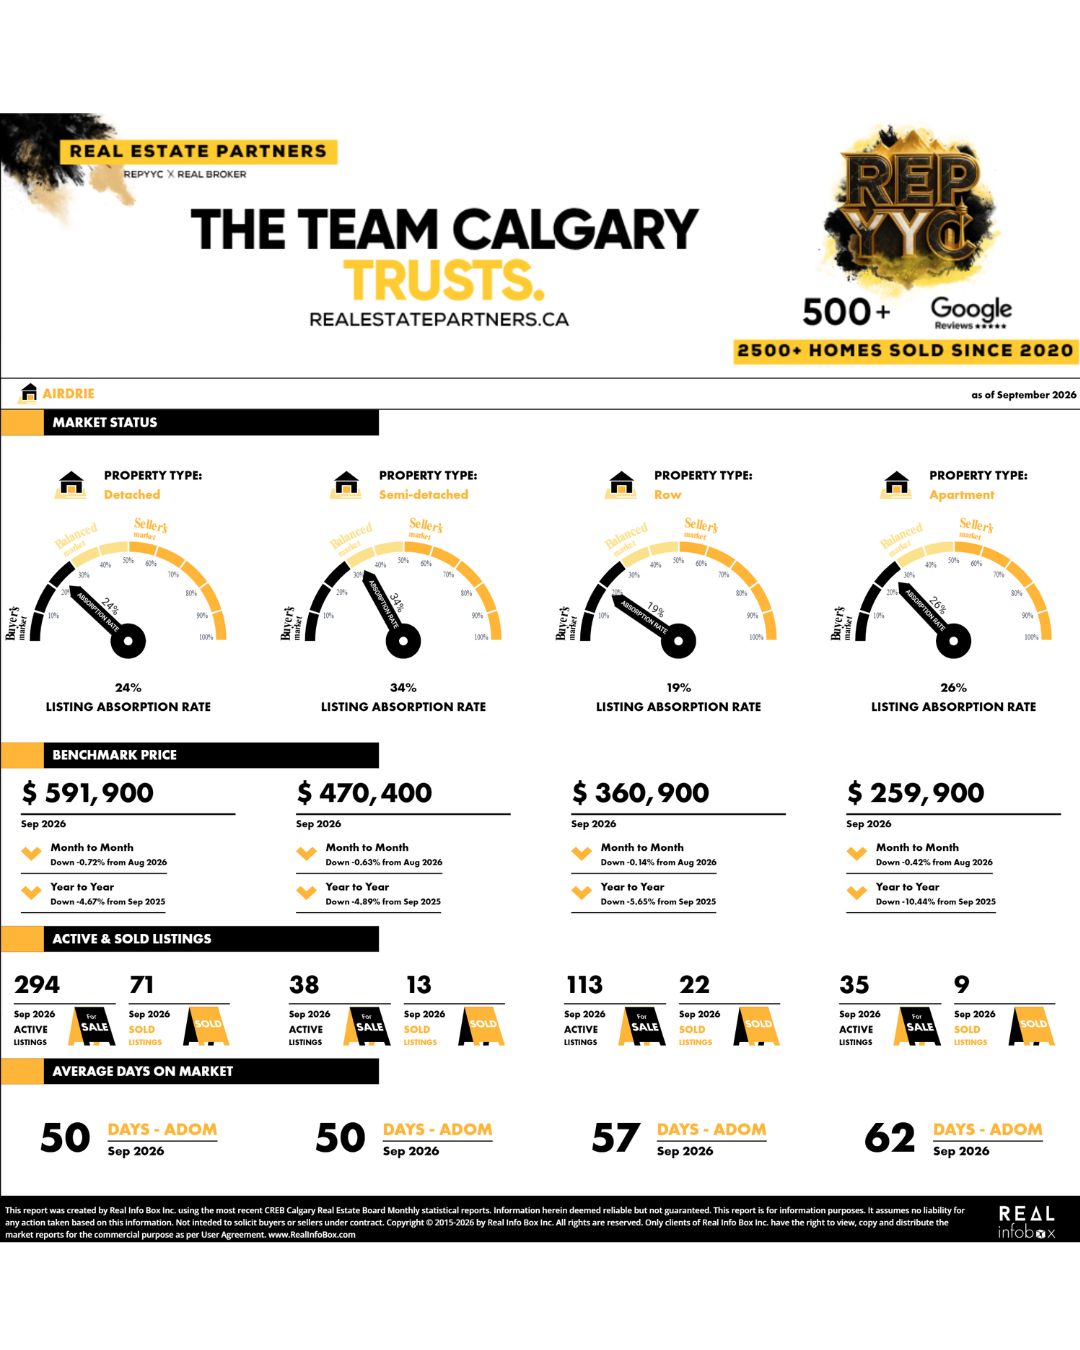
Average Real Estate Prices in Airdrie
Average Real Estate Prices in Chestermere
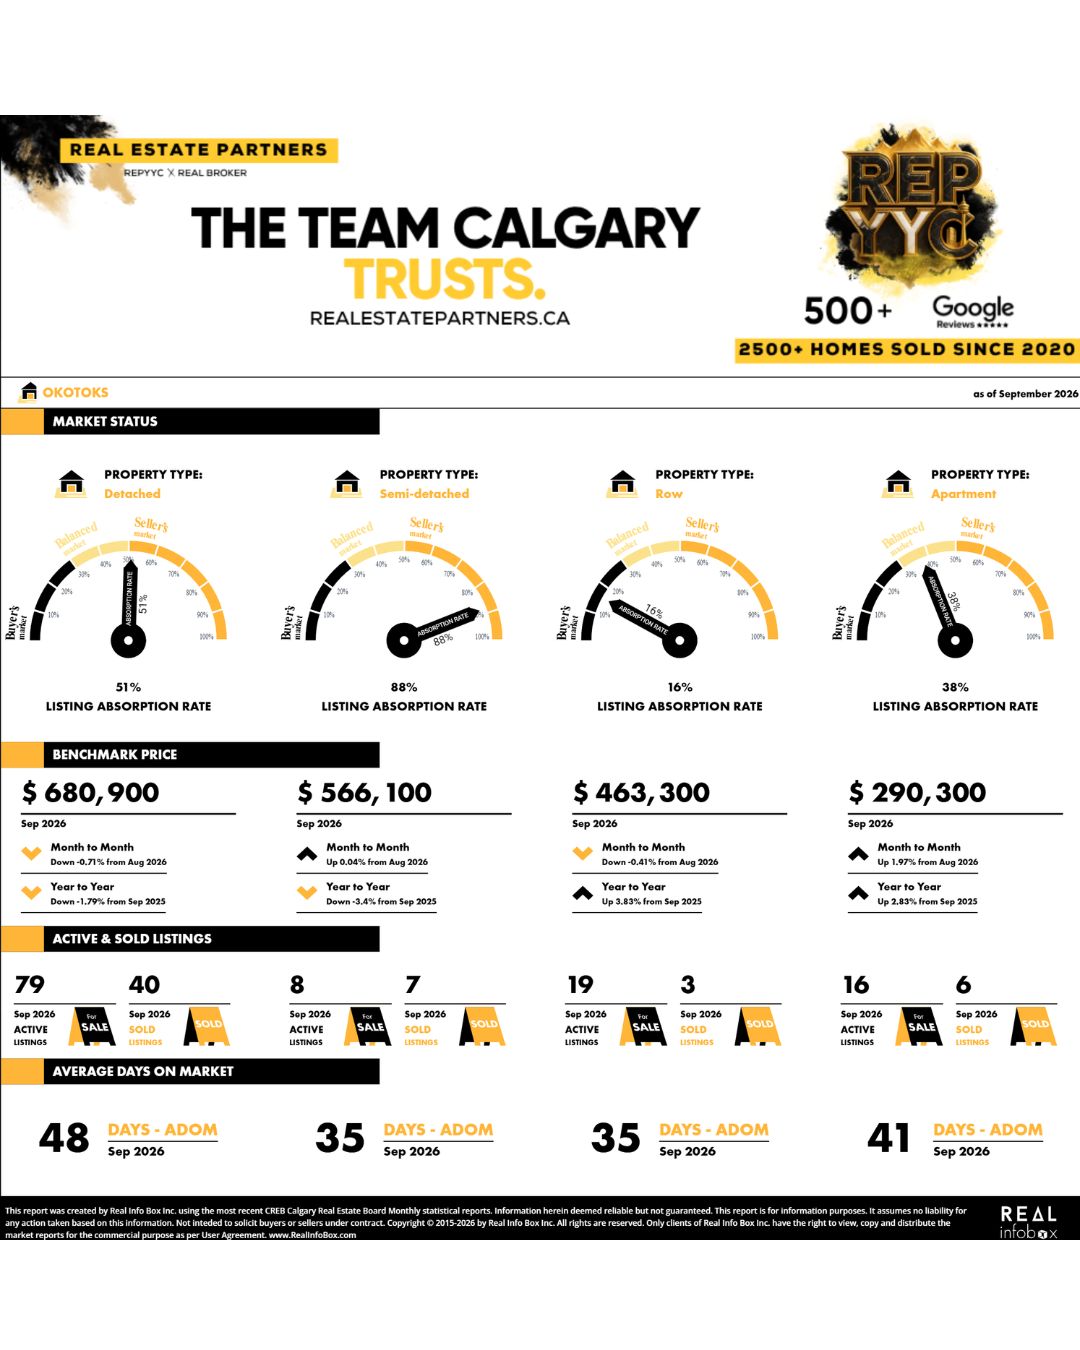
Average Real Estate Prices in Okotoks
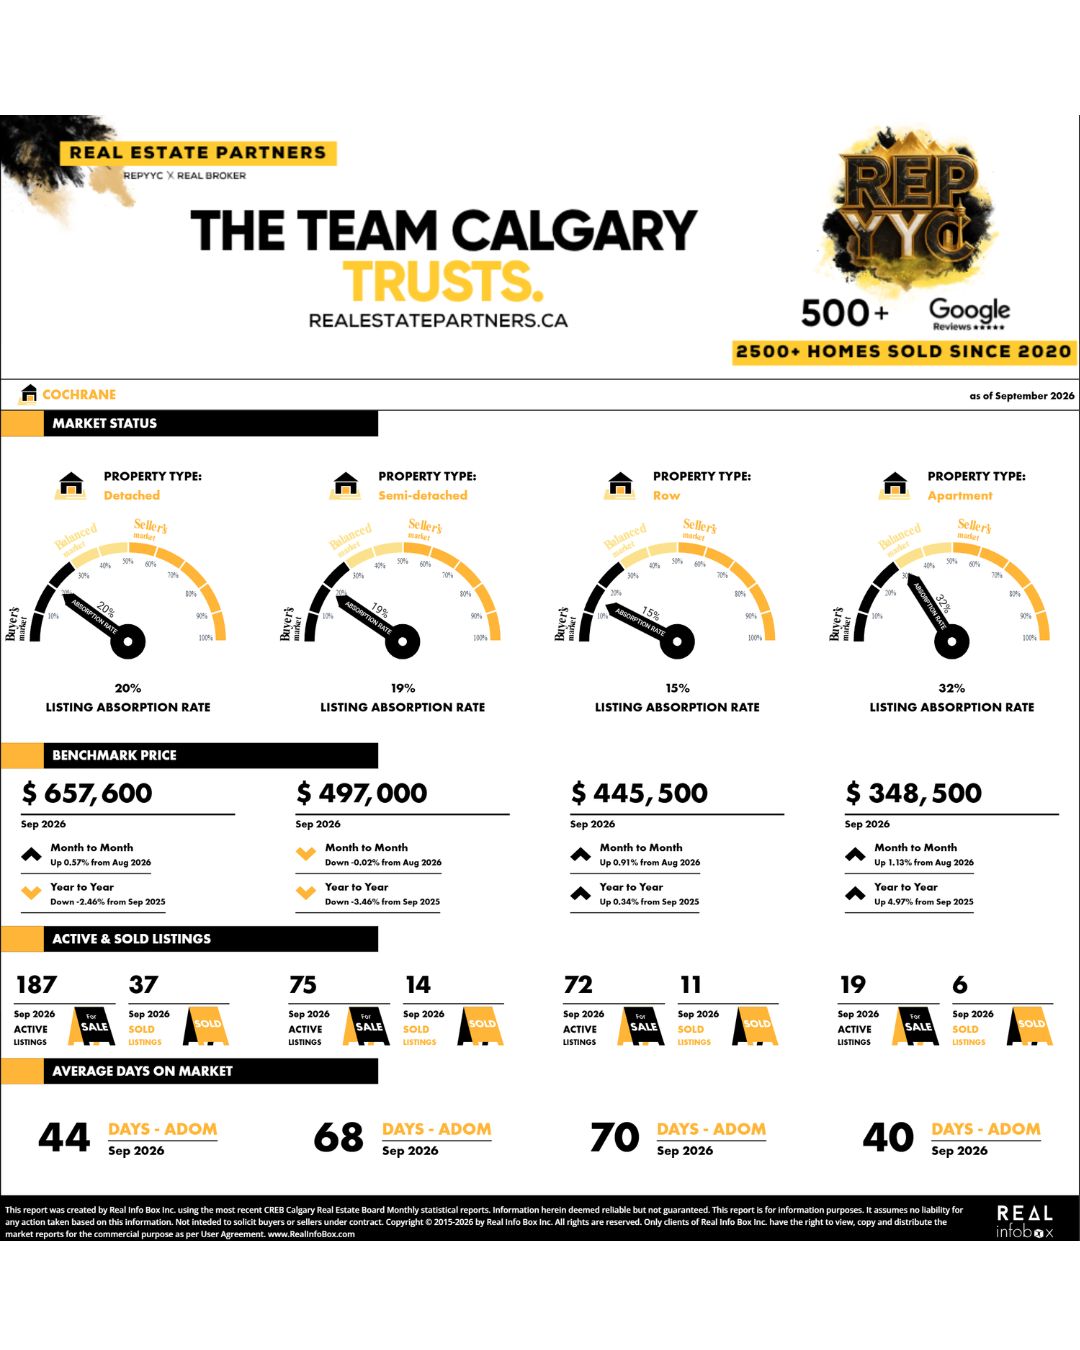
Average Real Estate Prices in Cochrane
Specific community spotlight real estate statistics
Braeside September 2026 Homes Statistics
| Sep-26 | YTD* | Y/Y% † | |
|---|---|---|---|
| Sales | 10 | 82 | -8.89% |
| New Listings | 18 | 126 | -7.35% |
| Inventory | 28 | 19 | 26.67% |
| Sales To New Listings Ratio | 55.56% | 65.08% | -1.66% |
| Benchmark Price | 461,000 | 464,155 | -3.54% |
| Median Price | 442,450 | 470,000 | -7.39% |
| Average Price | 480,090 | 502,703 | -2.35% |
| Average Days on Market | 33 | 36 | 33.33% |
Ramsay September 2026 Homes Statistics
| Sep-26 | YTD* | Y/Y% † | |
|---|---|---|---|
| Sales | 3 | 20 | -41.18% |
| New Listings | 2 | 39 | -23.53% |
| Inventory | 6 | 8 | 0.00% |
| Sales To New Listings Ratio | 150.00% | 51.28% | -23.08% |
| Benchmark Price | 632,900 | 662,644 | -1.37% |
| Median Price | 670,000 | 795,000 | -1.73% |
| Average Price | 629,667 | 796,220 | -9.17% |
| Average Days on Market | 72 | 39 | 34.48% |
Forest Heights September 2026 Homes Statistics
| Sep-26 | YTD* | Y/Y% † | |
|---|---|---|---|
| Sales | 4 | 42 | -19.23% |
| New Listings | 10 | 75 | -21.88% |
| Inventory | 17 | 11 | -21.43% |
| Sales To New Listings Ratio | 40.00% | 56.00% | 3.38% |
| Benchmark Price | 417,600 | 418,444 | -3.68% |
| Median Price | 461,000 | 423,500 | -2.84% |
| Average Price | 498,000 | 405,969 | -5.86% |
| Average Days on Market | 51 | 28 | -6.67% |
Tuscany September 2026 Homes Statistics
| Sep-26 | YTD* | Y/Y% † | |
|---|---|---|---|
| Sales | 16 | 209 | 0.48% |
| New Listings | 40 | 306 | 1.66% |
| Inventory | 54 | 36 | 0.00% |
| Sales To New Listings Ratio | 40.00% | 68.30% | -1.16% |
| Benchmark Price | 679,300 | 687,222 | -2.49% |
| Median Price | 781,750 | 695,000 | -0.14% |
| Average Price | 779,775 | 722,377 | 1.38% |
| Average Days on Market | 29 | 26 | 8.33% |
2026 Greater Calgary Regional Market Statistics
City Centre Calgary September 2026 Statistics
| Sep-26 | YTD* | Y/Y% † | |
|---|---|---|---|
| Sales | 332 | 3,079 | -15.64% |
| New Listings | 740 | 6,411 | -9.26% |
| Inventory | 1,523 | 1,387 | 1.31% |
| Sales To New Listings Ratio | 44.86% | 48.03% | -7.03% |
| Benchmark Price | 573,100 | 569,344 | -2.09% |
| Median Price | 596,000 | 585,000 | 15.30% |
| Average Price | 786,119 | 758,608 | 11.84% |
| Average Days on Market | 46 | 41 | 10.81% |
North Calgary September 2026 Statistics
| Sep-26 | YTD* | Y/Y% † | |
|---|---|---|---|
| Sales | 236 | 2,097 | -7.66% |
| New Listings | 426 | 4,018 | -6.67% |
| Inventory | 839 | 785 | 5.37% |
| Sales To New Listings Ratio | 55.40% | 52.19% | -1.06% |
| Benchmark Price | 523,000 | 524,933 | -5.55% |
| Median Price | 556,250 | 560,000 | -0.88% |
| Average Price | 536,268 | 553,418 | -1.42% |
| Average Days on Market | 46 | 41 | 13.89% |
Northeast Calgary September 2026 Statistics
| Sep-26 | YTD* | Y/Y% † | |
|---|---|---|---|
| Sales | 129 | 1,461 | -21.07% |
| New Listings | 370 | 3,642 | -19.37% |
| Inventory | 833 | 811 | -9.08% |
| Sales To New Listings Ratio | 34.86% | 40.12% | -2.10% |
| Benchmark Price | 461,200 | 467,877 | -7.50% |
| Median Price | 482,500 | 485,000 | -6.37% |
| Average Price | 496,243 | 484,496 | -4.65% |
| Average Days on Market | 49 | 46 | 15.00% |
East Calgary September 2026 Statistics
| Sep-26 | YTD* | Y/Y% † | |
|---|---|---|---|
| Sales | 54 | 455 | -20.18% |
| New Listings | 98 | 978 | -10.44% |
| Inventory | 219 | 204 | 10.27% |
| Sales To New Listings Ratio | 55.10% | 46.52% | -10.88% |
| Benchmark Price | 390,600 | 401,266 | -5.69% |
| Median Price | 434,500 | 437,500 | -2.78% |
| Average Price | 420,662 | 417,578 | -3.55% |
| Average Days on Market | 42 | 42 | 31.25% |
Southeast Calgary September 2026 Statistics
| Sep-26 | YTD* | Y/Y% † | |
|---|---|---|---|
| Sales | 223 | 2,482 | -7.32% |
| New Listings | 431 | 4,212 | -11.74% |
| Inventory | 797 | 786 | -2.00% |
| Sales To New Listings Ratio | 51.74% | 58.93% | 5.01% |
| Benchmark Price | 553,700 | 551,555 | -4.20% |
| Median Price | 552,000 | 564,175 | -2.73% |
| Average Price | 552,815 | 592,223 | -1.27% |
| Average Days on Market | 42 | 40 | 14.29% |
South Calgary September 2026 Statistics
| Sep-26 | YTD* | Y/Y% † | |
|---|---|---|---|
| Sales | 328 | 3,079 | -8.01% |
| New Listings | 574 | 5,137 | -8.14% |
| Inventory | 1,020 | 878 | 3.29% |
| Sales To New Listings Ratio | 57.14% | 59.94% | 0.15% |
| Benchmark Price | 569,500 | 570,266 | -2.53% |
| Median Price | 588,500 | 600,000 | -0.83% |
| Average Price | 619,923 | 623,995 | 0.92% |
| Average Days on Market | 39 | 35 | 16.67% |
West Calgary September 2026 Statistics
| Sep-26 | YTD* | Y/Y% † | |
|---|---|---|---|
| Sales | 156 | 1,761 | -1.51% |
| New Listings | 319 | 3,012 | -5.22% |
| Inventory | 556 | 517 | 0.98% |
| Sales To New Listings Ratio | 48.90% | 58.47% | 3.93% |
| Benchmark Price | 721,200 | 719,733 | 0.63% |
| Median Price | 790,250 | 745,000 | -0.17% |
| Average Price | 833,302 | 812,657 | 1.30% |
| Average Days on Market | 36 | 32 | 10.34% |
Northwest Calgary September 2026 Statistics
| Sep-26 | YTD* | Y/Y% † | |
|---|---|---|---|
| Sales | 187 | 1,843 | -8.13% |
| New Listings | 383 | 3,226 | -5.97% |
| Inventory | 670 | 582 | 12.57% |
| Sales To New Listings Ratio | 48.83% | 57.13% | -2.29% |
| Benchmark Price | 627,000 | 624,811 | -2.34% |
| Median Price | 695,000 | 675,000 | -0.74% |
| Average Price | 706,925 | 691,718 | 0.70% |
| Average Days on Market | 44 | 35 | 16.67% |
Airdrie Real Estate September 2026 Statistics
| Sep-26 | YTD* | Y/Y% † | |
|---|---|---|---|
| Sales | 115 | 1,198 | -13.06% |
| New Listings | 213 | 2,296 | -9.64% |
| Inventory | 481 | 475 | 4.17% |
| Sales To New Listings Ratio | 53.99% | 52.18% | -3.78% |
| Benchmark Price | 505,800 | 512,822 | -4.70% |
| Median Price | 505,000 | 515,000 | -5.50% |
| Average Price | 522,989 | 530,250 | -4.84% |
| Average Days on Market | 52 | 45 | 15.38% |
Calgary Detached Homes September 2026 Statistics
| Sep-26 | YTD* | Y/Y% † | |
|---|---|---|---|
| Sales | 896 | 8,626 | -3.21% |
| New Listings | 1,727 | 15,244 | -7.01% |
| Inventory | 2,971 | 2,574 | -0.58% |
| Sales To New Listings Ratio | 51.88% | 56.59% | 4.10% |
| Benchmark Price | 739,400 | 741,211 | -2.26% |
| Median Price | 686,750 | 700,000 | -2.10% |
| Average Price | 823,483 | 819,928 | 0.69% |
| Average Days on Market | 37 | 33 | 10.00% |
Calgary Semi-Detached Homes September 2026 Statistics
| Sep-26 | YTD* | Y/Y% † | |
|---|---|---|---|
| Sales | 163 | 1,678 | -1.93% |
| New Listings | 359 | 2,904 | -2.58% |
| Inventory | 599 | 528 | 10.23% |
| Sales To New Listings Ratio | 45.40% | 57.78% | 0.66% |
| Benchmark Price | 685,200 | 684,733 | -0.28% |
| Median Price | 585,000 | 585,000 | -4.10% |
| Average Price | 686,328 | 684,641 | -0.86% |
| Average Days on Market | 42 | 40 | 29.03% |
Calgary Row Home September 2026 Statistics
| Sep-26 | YTD* | Y/Y% † | |
|---|---|---|---|
| Sales | 248 | 2,647 | -15.62% |
| New Listings | 552 | 5,113 | -8.86% |
| Inventory | 1,102 | 1,035 | 6.37% |
| Sales To New Listings Ratio | 44.93% | 51.77% | -7.42% |
| Benchmark Price | 412,400 | 420,722 | -5.82% |
| Median Price | 405,000 | 419,895 | -6.17% |
| Average Price | 432,178 | 444,775 | -4.93% |
| Average Days on Market | 50 | 42 | 23.53% |
Calgary Condominium September 2026 Statistics
| Sep-26 | YTD* | Y/Y% † | |
|---|---|---|---|
| Sales | 343 | 3,340 | -24.67% |
| New Listings | 717 | 7,472 | -17.24% |
| Inventory | 1,816 | 1,841 | -0.32% |
| Sales To New Listings Ratio | 47.84% | 44.70% | -8.98% |
| Benchmark Price | 291,400 | 298,366 | -8.67% |
| Median Price | 288,000 | 295,000 | -7.81% |
| Average Price | 318,759 | 334,516 | -4.29% |
| Average Days on Market | 55 | 51 | 21.43% |
*Year-To-Date as of Oct 6th, 2026
†Year-To-Date, year over year percent change. ‡Calgary Census Metropolitan Area includes Calgary, Airdrie, and Rocky View
Enjoy this blog post? Click here to subscribe for updates
Leave A Comment