
Mayland Heights Real Estate Statistics
| Average Price | $638K |
|---|---|
| Lowest Price | $215K |
| Highest Price | $1.6M |
| Total Listings | 15 |
| Avg. Days On Market | 50 |
| Avg. Price/SQFT | $491 |
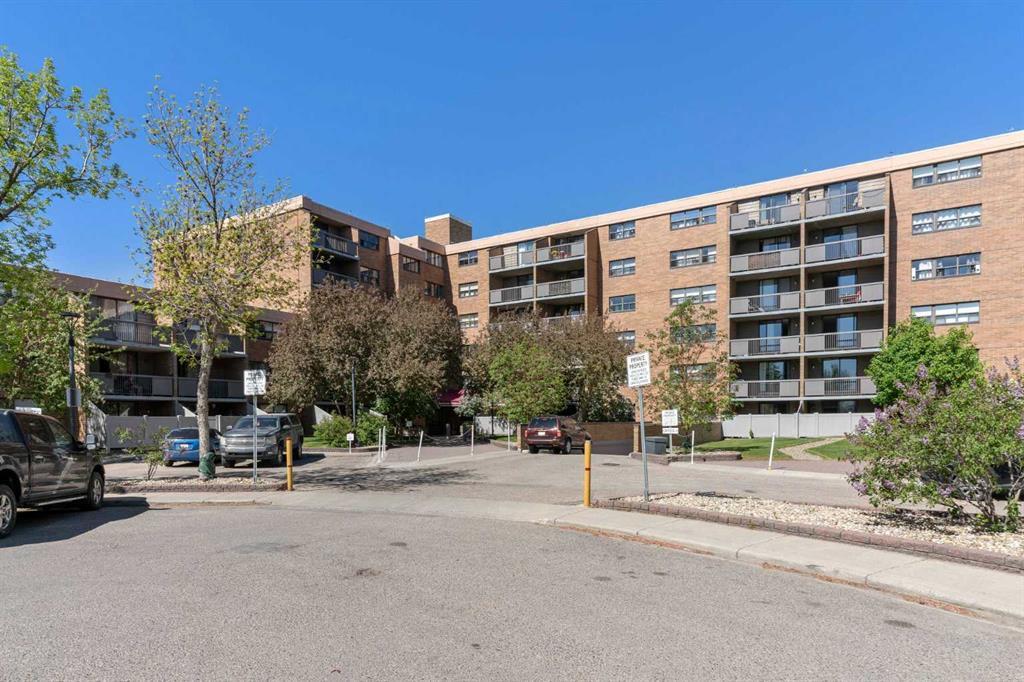
Property Types (active listings)
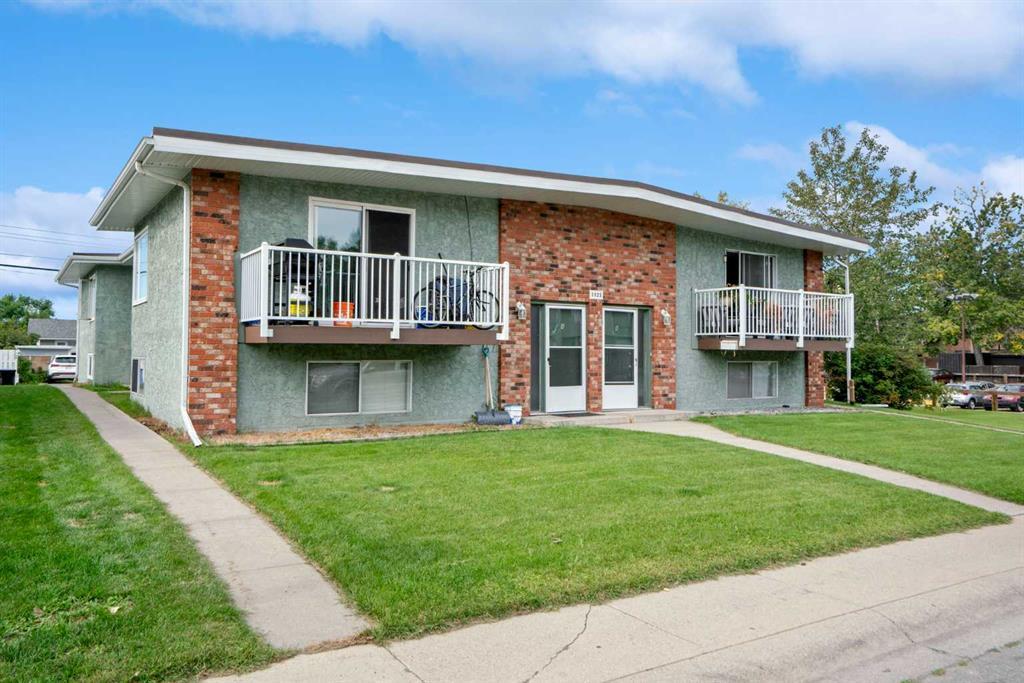
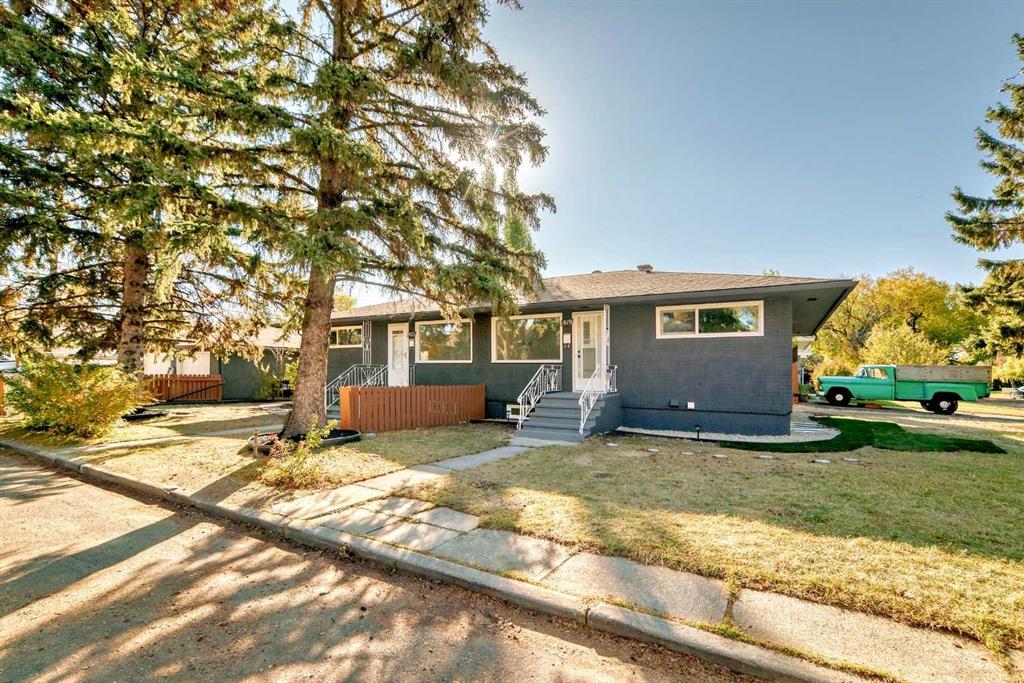
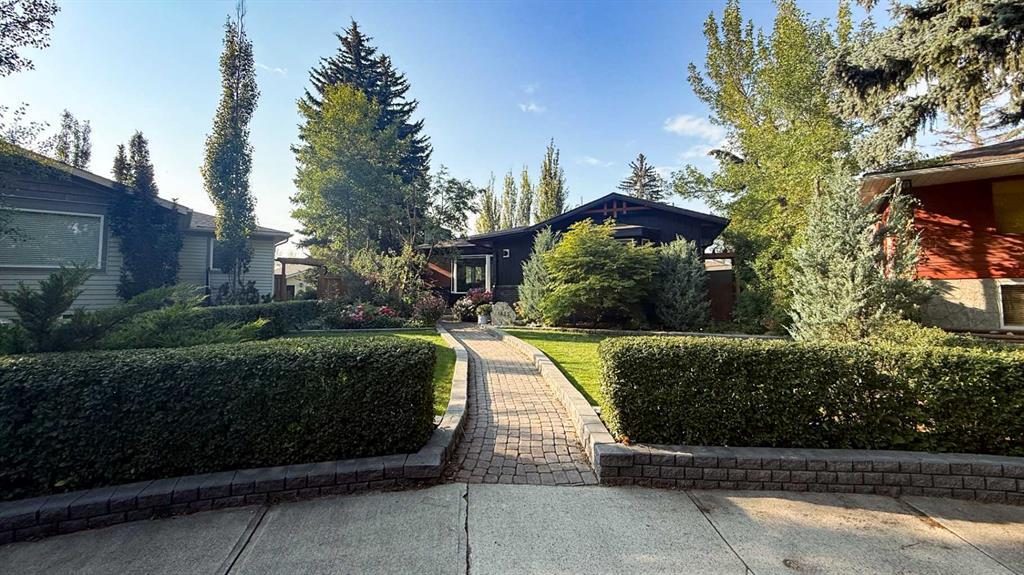
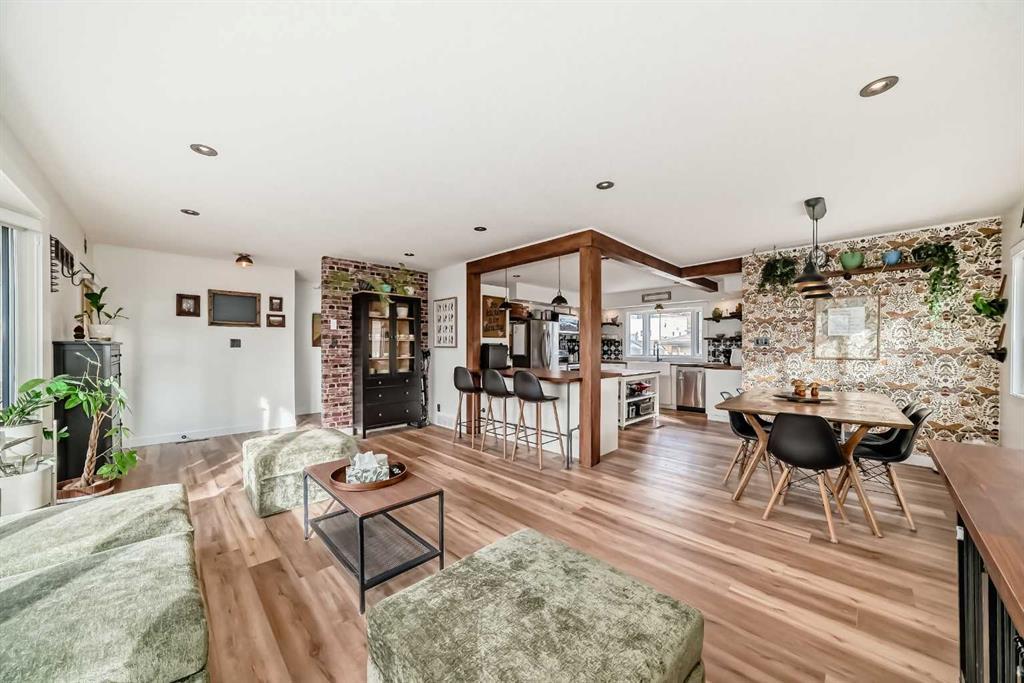
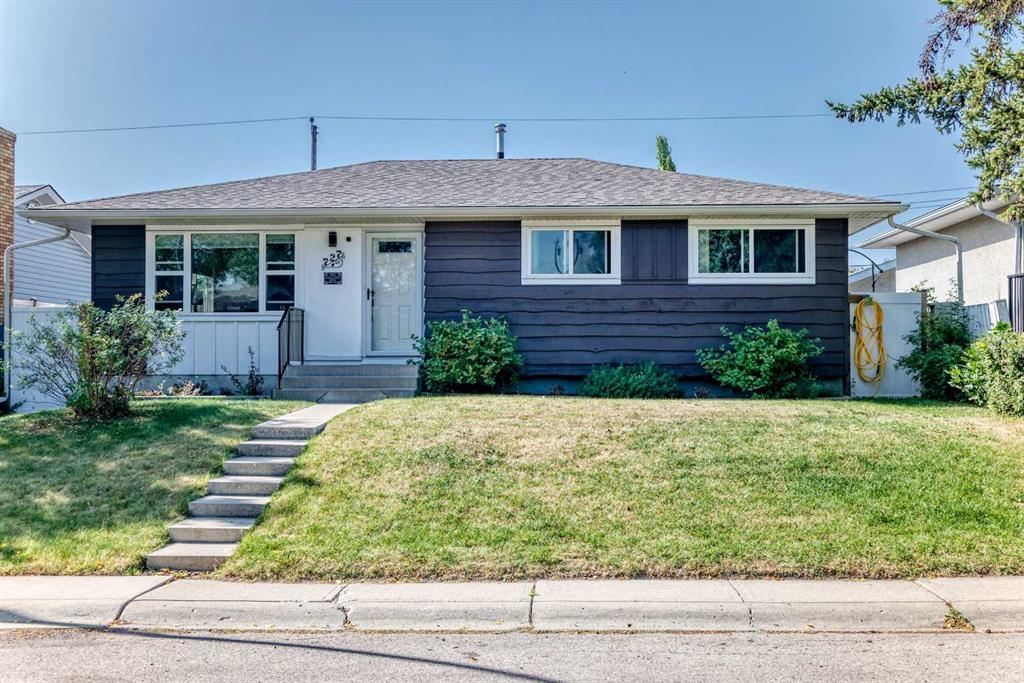
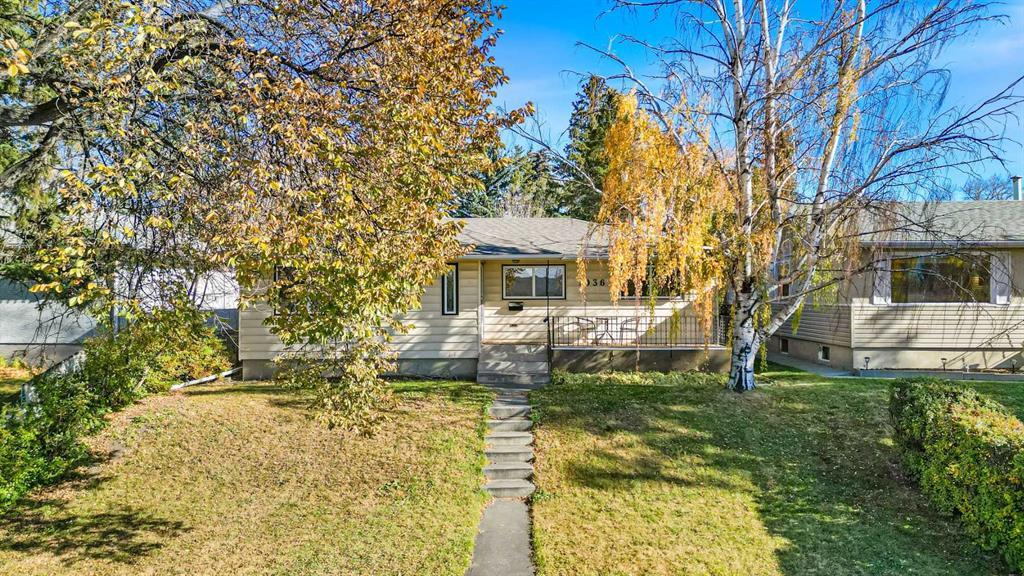
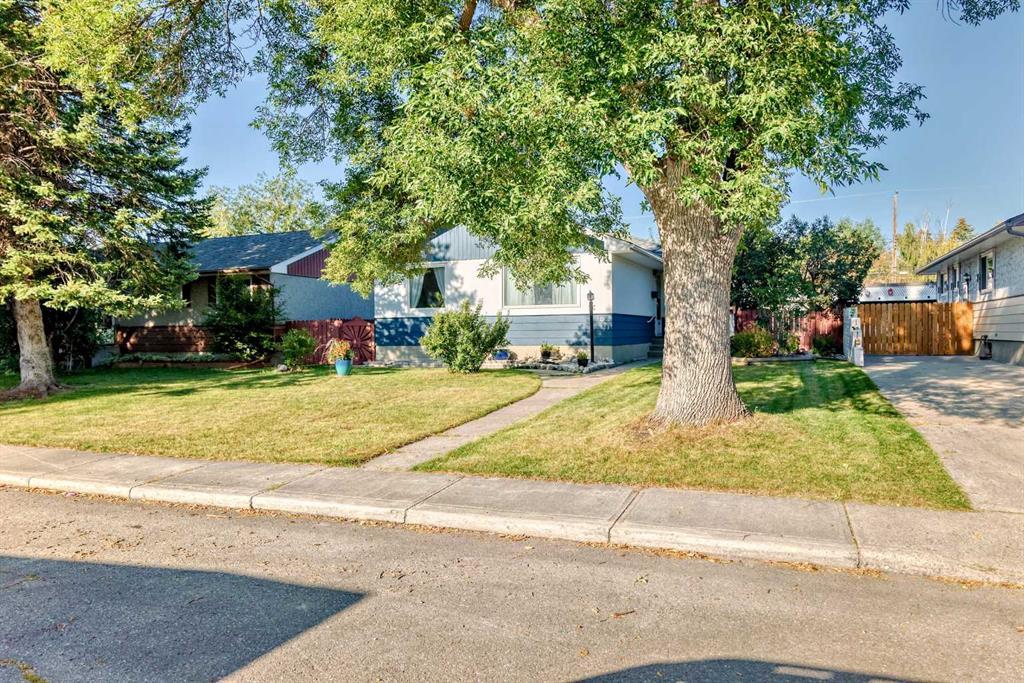
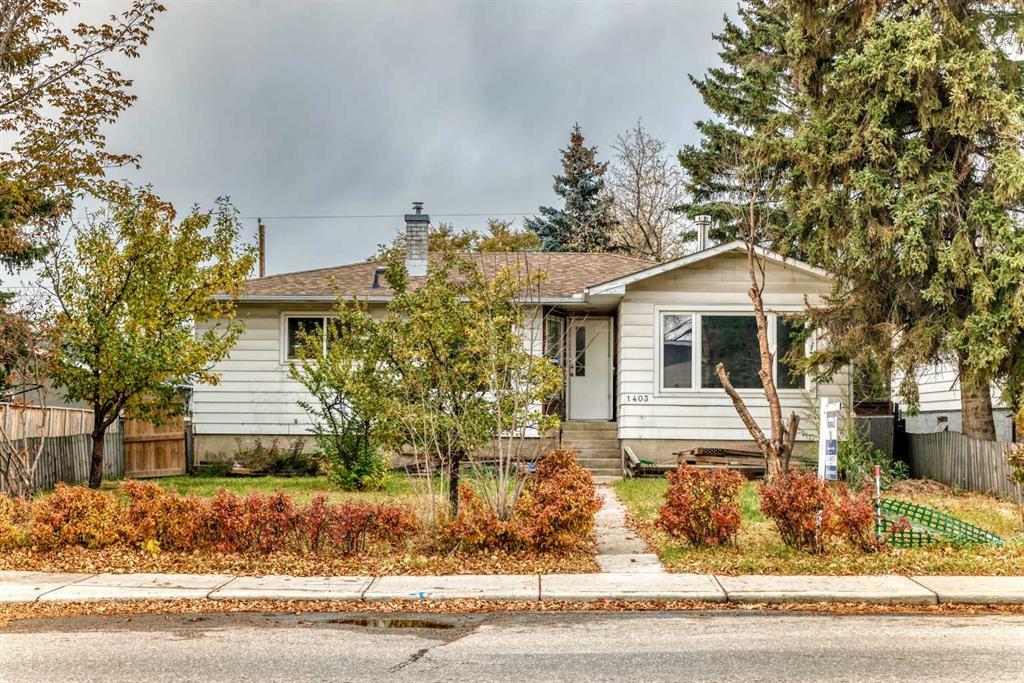
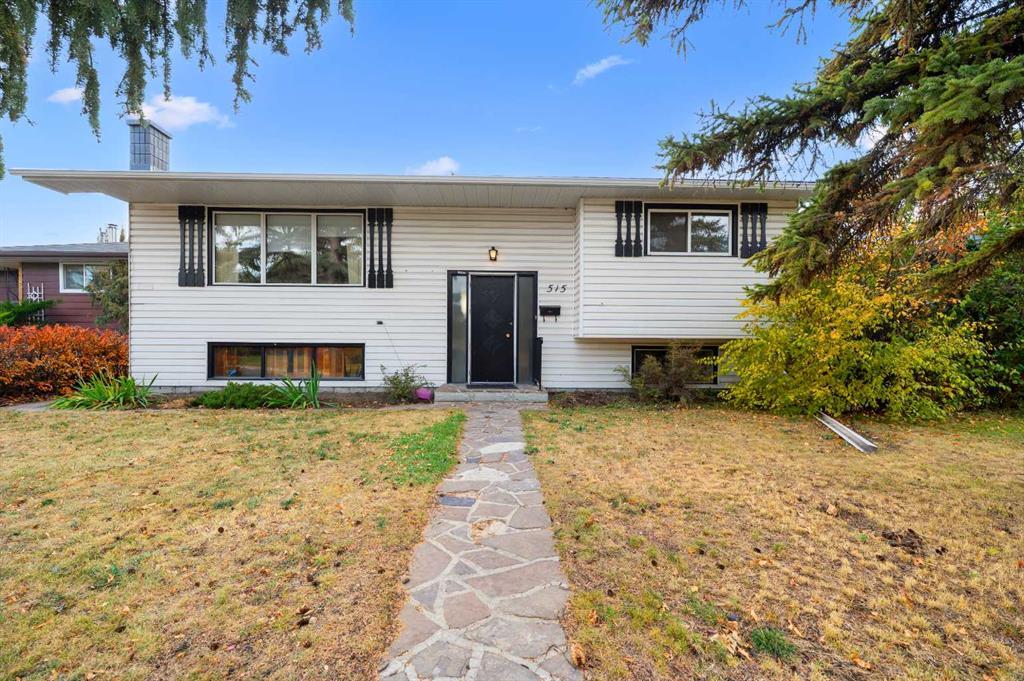
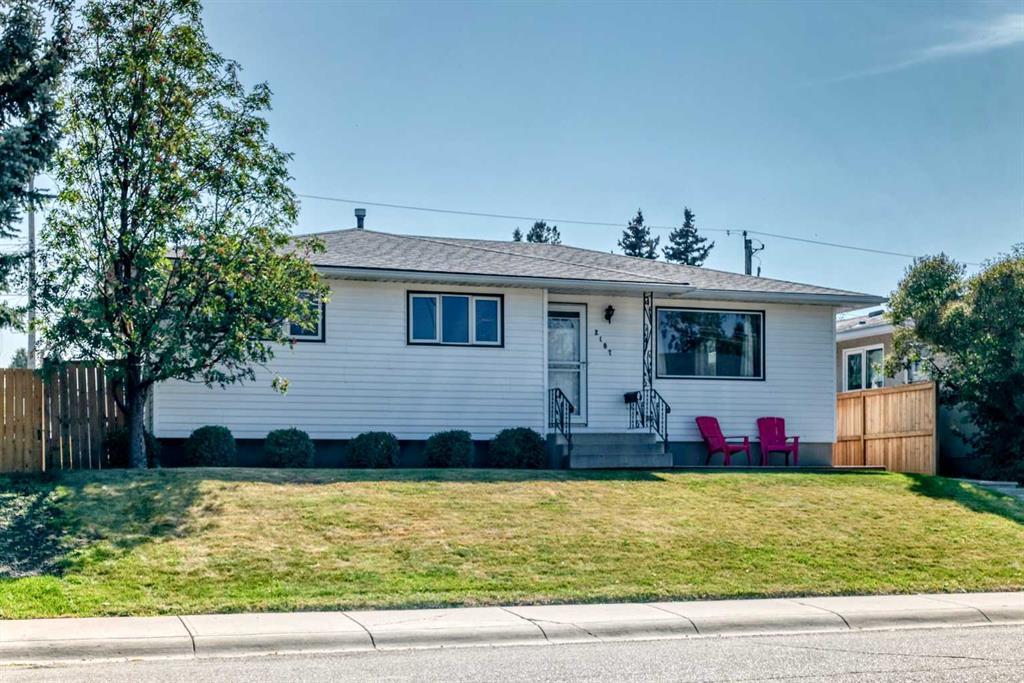
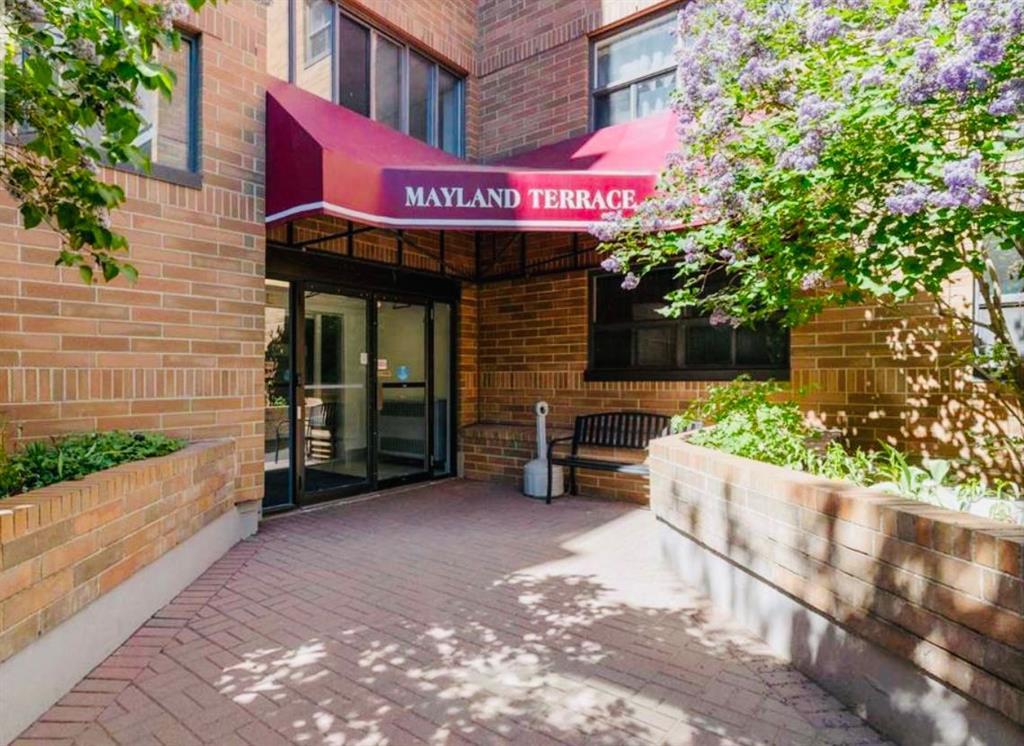
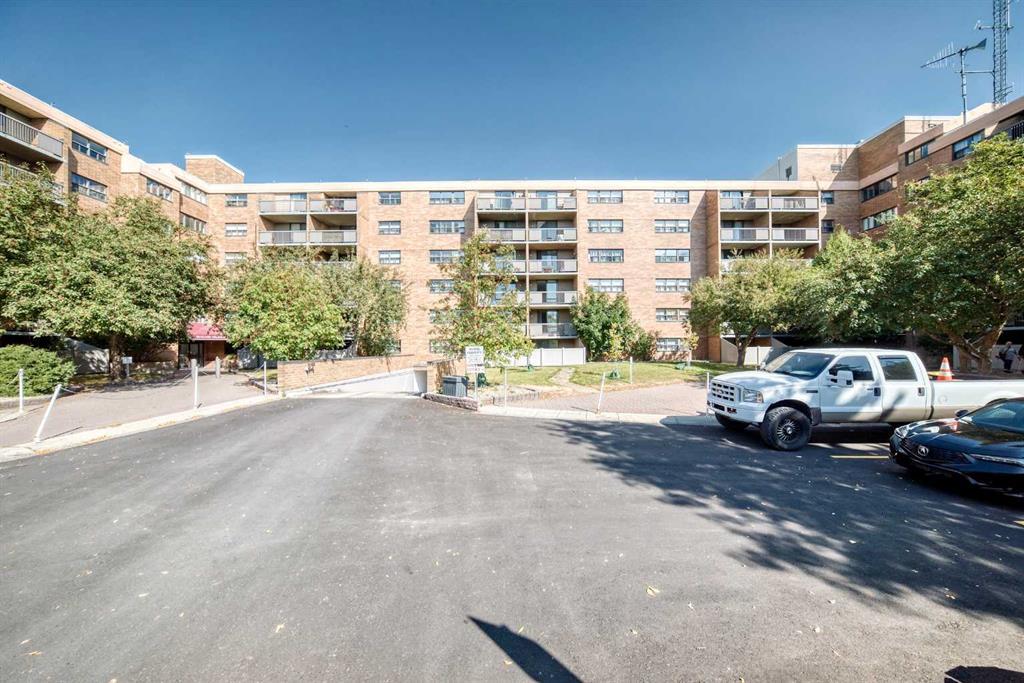
Mayland Heights Homes for Sale Calgary

Amenities in Mayland Heights
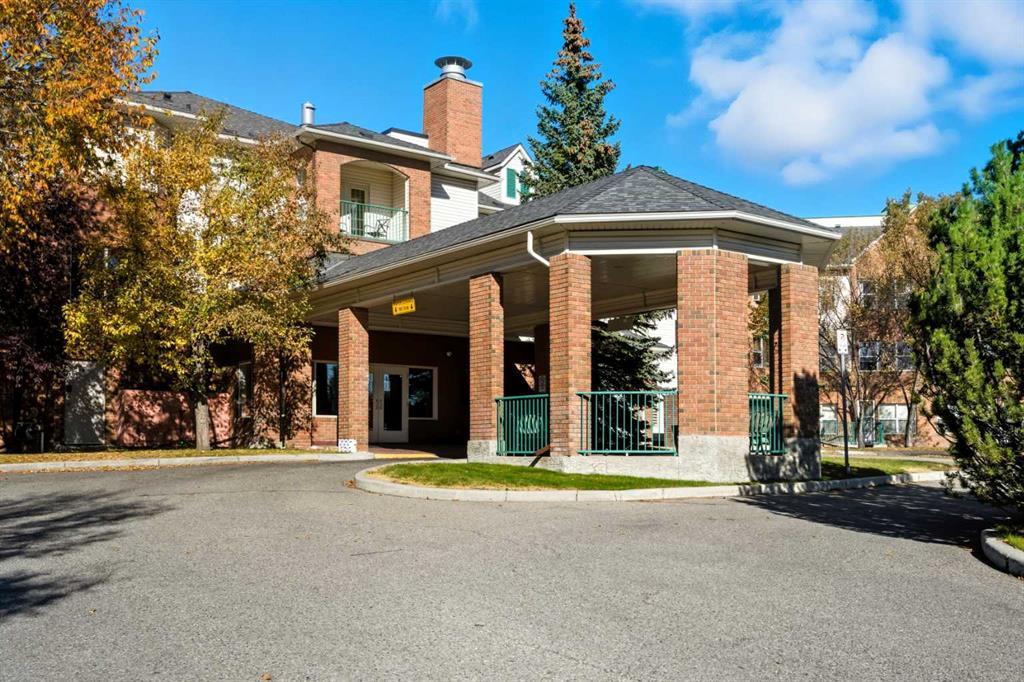
Mayland Heights is a vibrant neighbourhood nestled in the northeast quadrant of Calgary, Alberta. This residential community offers an eclectic mix of city convenience and calm suburban living, perfect for homeowners looking for an area with easy access to both the heart of Calgary and the tranquillity of nearby parks and the Bow River.
Straegically positioned near Deerfoot Trail and 16th Avenue, residents enjoy quick access to nearby amenities including shopping centres, a variety of eateries, and entertainment hotspots.
Mayland Heights features a range of businesses, from cozy coffee shops and various ethnic eateries to a variety of retail shops and service providers. Some of Calgary’s most popular amenities are located nearby such as Calgary Zoo and TELUS Spark Science Centre.
Mayland Heights Fitness and Recreation Opportunities
Mayland Heights offers access to several fitness and wellness facilities. Within a 10-minute drive, residents can choose from World Gym, GoodLife, Fit4Less, GYMVMT, Gold’s Gym, and many others. There are endless options for physical fitness and tailored wellness programs, like Olympus Boxing Club.
The Renfrew Aquatic & Recreation Centre is nearby, a multi-purpose recreation facility offering a wide variety of activities and services. The centre features an indoor pool, cardio equipment, a weight room, and a steam room.
Golf lovers in Mayland Heights can tee off at Fox Hollow Golf Course or McCall Lake Golf Course, both situated within a short drive. These facilities both offer stunning city views and well-maintained greens.
For families, the Calgary Zoo, TELUS Spark Science Centre, and the Aero Space Museum of Calgary are all within a short drive, providing educational and fun-filled experiences for all ages.
Mayland Heights Shopping and Dining
Mayland Heights is home to a diverse array of dining establishments. Start the day with a locally roasted coffee at Waves Coffee House. For lunch or dinner, head over to Lil’ Empire Burger in Bridgeland for a casual bite and Pacini Calgary, or end the night with East African cuisine at Safari Grill. End the day with housemade gelato and sorbetto at Righteous Gelato.
Marlborough Mall is right next door, a large indoor shopping complex with an array of shops, restaurants, and a food court. Shop for daily necessities at popular outlets like Walmart, Canadian Tire, and Shoppers Drug Mart. Marlborough Mall also provides several dining options ranging from Red Lobster and Olive Garden to Tim Hortons and Wendy’s.
Sunridge Mall, located only minutes away, is a large, enclosed shopping centre with a variety of retail stores, restaurants, and a food court. The mall features well-known brands like Hudson's Bay, Sport Chek, Winners, and a Cineplex Odeon across the street.
For nightlife, residents can head up to Deerfoot City. This shopping complex features the Rec Room, a massive amusement centre that includes arcade games, restaurants, and bars. Various local pubs and venues also offer a more laid-back atmosphere for an evening out.
Schools Serving Mayland Heights
Mayland Heights provides a variety of schooling options for children. Choose from public, catholic, or private schools for elementary, middle school, or high school programs.
Public school options include Mayland Heights School, Belfast, Colonel Macleod, and Crescent Heights High School.
Catholic school options include St. Alphonsus, St. Isidore, St. Isidore, St. Mary’s High School, Bishop Carroll High School, and St. Francis High School.
Private school options include Asasa Private School, Mountain View Academy, and Sterling Education.
Childcare options in Mayland Heights include Kids World Childcare, Play N Learn Childcare Centre, and Mayland Heights Child Care Centre.
Transportation in Mayland Heights
Mayland Heights residents have access to Calgary Transit bus routes 19, 27, 33, and 303. The nearest LRT Station is Barlow-Max Bell Station.
Mayland Heights is bound by Barlow Trail to the east, Memorial Drive to the south, Deerfoot Trail to the west and Trans-Canada Highway to the north.
Mayland Heights FAQs
Is there a local community association in Mayland Heights?
Mayland Heights is covered by the Crossroads Community Association. The association offers a variety of programs and events throughout the year, such as the annual Family Fun Day, Carnival & Pancake Breakfast, and various recreational activities.
How long is the commute to downtown Calgary?
The commute from Mayland Heights to downtown Calgary takes 9 minutes by car or 38 minutes by public transportation.
What is the average household income in Mayland Heights?
The average household income in Mayland Heights is $70,206.
Is Mayland Heights a safe place to live?
The violent crime rates in Mayland Heights are 1% lower than the Calgary average.
Mayland Heights Community Information
The community of Mayland heights is a beautiful cozy neighborhood that is nestled in the inner regions of the northeast in Calgary. Affordable homes through the area in a variety of sizes Conveniently located near golf courses, crystal lake and a selection of recreational facilities. A safe community with some of the best access to major roadways throughout the city, scroll below to see a complete list of properties for sale in the community of Mayland Heights in Calgary, Alberta.
Hospitals and Clinics Serving Mayland Heights
Mayland Heights is a 9-minute drive from Peter Lougheed Centre. There are nearby options for a variety of therapies and specialty health clinics. The closest veterinary clinics are Barlow Trail Animal Hospital and Sunridge Veterinary Clinic.
Quick Facts About Mayland Heights
-
Quadrant: Northeast Calgary
-
Density (Individuals Per Square KM): 3,287
-
Violent crime rates are 1% lower than the Calgary average.
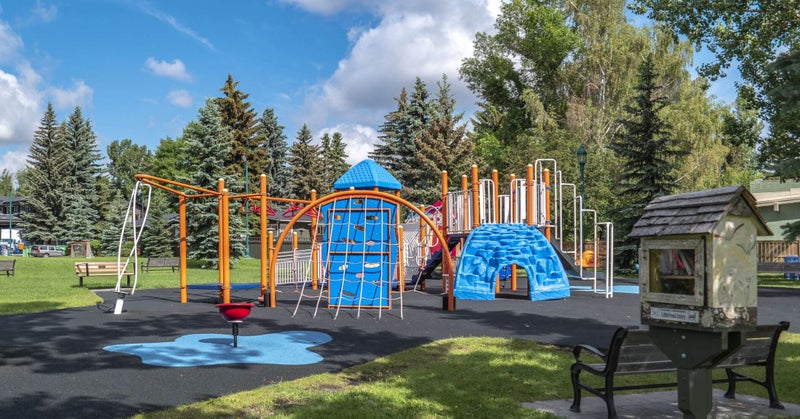
Mayland Heights Parks and Outdoors
Outdoor enthusiasts will love the abundance of green space found in Mayland Heights. The community has several small local parks including the nearby Deerfoot Athletic Park ad Airways Park.
Tom Campbell's Hill Natural Park, located in the southeastern part of the community, is a wonderful place for hiking and offers panoramic views of the Calgary skyline and the Rocky Mountains.
The Bow River and its associated river pathways system are also within a short distance, providing ample opportunities for kayaking, fishing, and bird watching.
A 20-minute drive from Mayland Heights, residents can head to Prairie Winds Park, a popular park in northeast Calgary. Features include a large playground, a toboggan hill, tennis courts, and even a splash park for hot summer days.
For another day trip, residents can drive to Elliston Park, home of the annual GlobalFest fireworks competition. This beautiful park has a large pond for bird-watching and fishing, a regional pathway, picnic sites, and an off-leash area for dogs.
Ready to Make Mayland Heights Home?
Our experienced real estate team at Real Estate Partners with REAL BROKER is here to help you navigate the Mayland Heights market, and our team services are outstanding. Whether you're looking to buy, sell, or simply learn more about the community, we are always here for you. Contact us today to schedule a private home showing or request a free market evaluation of your Mayland Heights property. Explore the latest Mayland Heights homes for sale in this established northeast Calgary community. Be sure to view Mayland Heights open houses to explore available properties and experience the neighborhood in person.
Why Choose The Real Estate Partners at Real Broker?
We are a top-performing real estate team in Calgary with over 325 five-star reviews and numerous stellar testimonials from clients just like you. Contact us to get started and learn more about Mayland Heights seller and buyer representation.
Thinking of selling your home in Mayland Heights?
Visit our Home Evaluation page to begin a free comparative market analysis. Our team provides comprehensive guides tailored to the Mayland Heights real estate market.

Start searching for your dream home now.
When it comes to convenience, our site is unparalleled. Whether you're in the comfort of your home, or on the go.
Our site works flawlessly on multiple devices so you can find the information you need.