
January 2022 Calgary Real Estate Statistics Recap
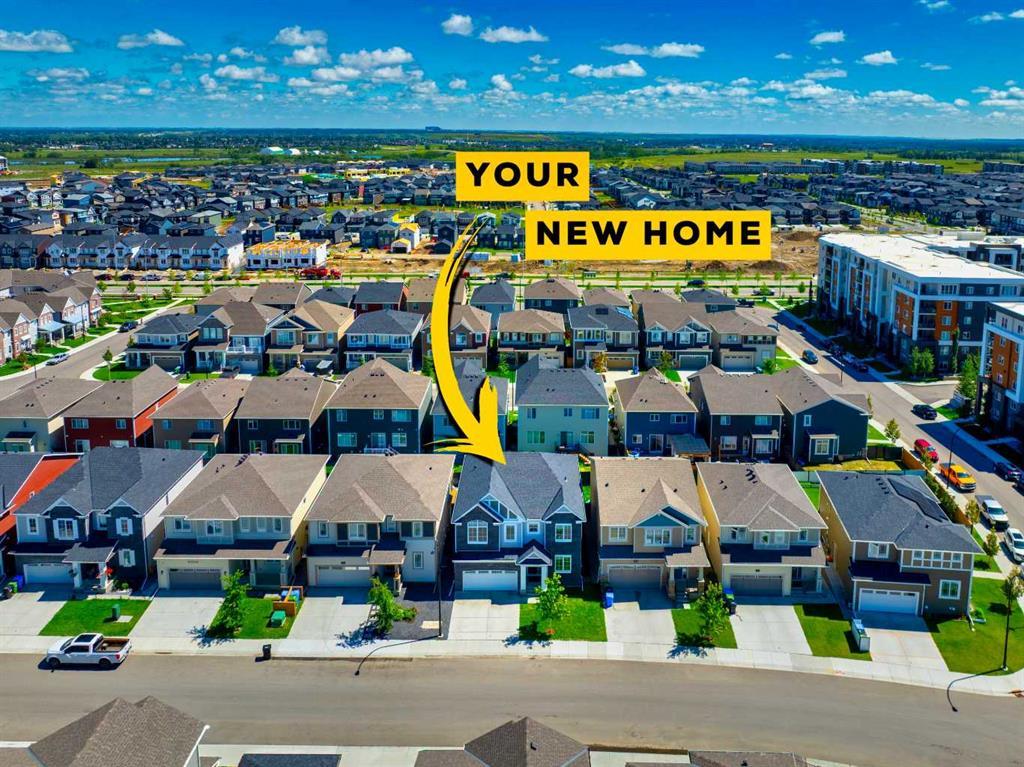
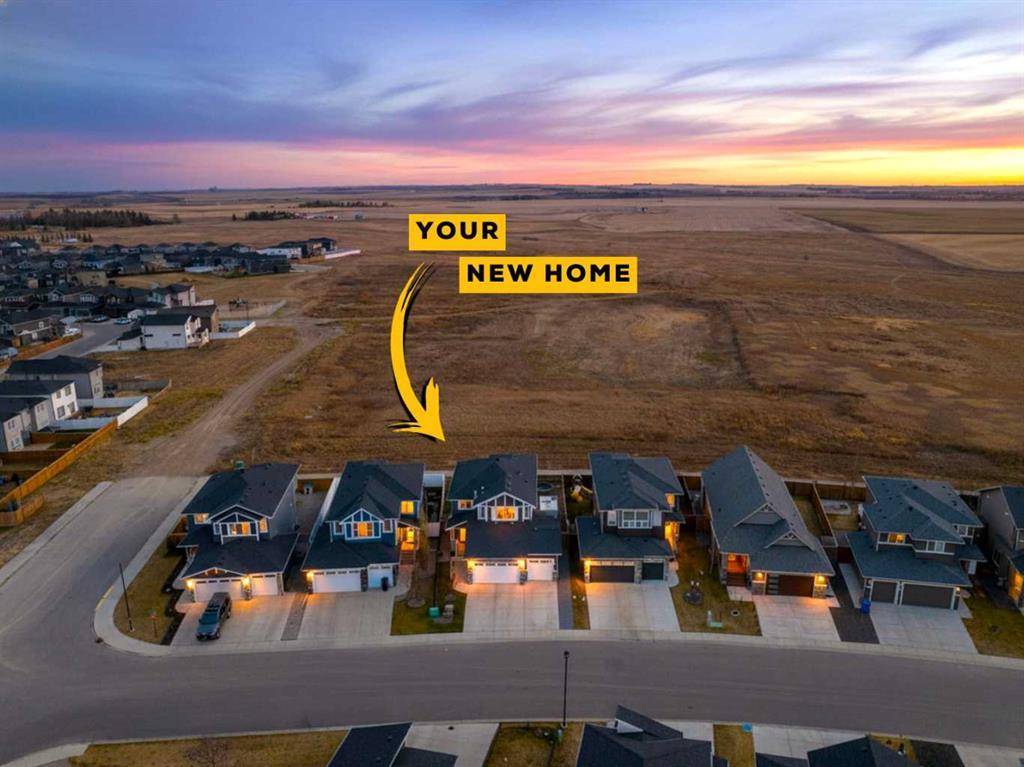
To summarize the Calgary January 2022 real estate market in one video thumbnail... In January 2022 we saw multiple listings go for over six figures above list price, with unconditional offers!
Inventory in Calgary is now at only 2,620 units, this represents a significant decrease (35% from 2021) with sales up over 66%! This months supply levels reached the lowest we've seen since 2006.
“Expected gains in lending rates are contributing to persistently strong demand in the housing market, as purchasers are eager to get ahead of any increases,” said CREB® Chief Economist Ann-Marie Lurie. “We did see more listings this month, but it did little to change the market balance or take any pressure off prices. This was expected, as these conditions should persist for several more months.”
January Calgary Real Estate Statistics
For optimal viewing, click the infographic to view as a PDF

Latest Combined Calgary Real Estate Statistics: January 2022
- Benchmark Price $472,300
- Inventory 2,620
- Sales to New Listings Ratio 81%
- Months of Inventory/Supply 1.30 Months of supply (Down 61.0% Y/Y)
Year to Date Calgary Real Estate Statistics: January 2022
- Benchmark Price $472,300
- Sales to New Listings Ratio 81%
- Months of Inventory/Supply 1.30 Months of supply (Down 61.0% Y/Y)
DOM = Number of Days on Market
As of January 31st 2022, the average number of days on market for all property types combined was 33 days (YTD) while the month of January saw an average DOM of 33.
MLS® Listings in Calgary (New)
As of January 31st 2022, the total number of new active listings in the city of Calgary added to the market was 1,295 and in total there have been 1,295 YTD
Homes Sold in Calgary January 2022
The total number of homes sold for the month of January in Calgary was 1,148 which represents a 56.62% increase Y/Y. The total sales for 2022 are 1,148 which represents a 56.62% increase Y/Y.
Average Real Estate Prices in Calgary
In January 2022 the average price for a detached home in the city of Calgary was $624,161.
2022 Greater Calgary Regional Market Statistics
For best viewing, click the infographic to view as a PDF

Specific community spotlight real estate statistics
Discovery Ridge Detached Homes
| Jan-22 | YTD* | Y/Y% † | |
|---|---|---|---|
| Sales | 5 | 5 | -16.67% |
| New Listings | 2 | 2 | -66.67% |
| Sales to New Listings Ratio | 250.00% | 250.00% | 150.00% |
| Inventory | Insufficient Data | Insufficient Data | Insufficient Data |
| Average Days on Market | 51 | 51 | -15.00% |
| Benchmark Price | 966,300 | 966,300 | 0.00% |
| Average Price | 931,100 | 931,100 | 11.21% |
| Median Price | 755,000 | 755,000 | -11.70% |
Cranston Detached Homes
| Jan-22 | YTD* | Y/Y% † | |
|---|---|---|---|
| Sales | 24 | 24 | 26.32% |
| New Listings | 32 | 32 | 18.52% |
| Sales to New Listings Ratio | 75.00% | 75.00% | 4.63% |
| Inventory | 17 | 17 | -50.00% |
| Average Days on Market | 14 | 14 | -73.58% |
| Benchmark Price | 597,500 | 597,500 | 0.00% |
| Average Price | 794,812 | 794,812 | 49.65% |
| Median Price | 702,500 | 702,500 | 39.11% |
Hillhurst Detached Homes
| Jan-22 | YTD* | Y/Y% † | |
|---|---|---|---|
| Sales | 7 | 7 | 133.33% |
| New Listings | 8 | 8 | -11.11% |
| Sales to New Listings Ratio | 87.50% | 87.50% | 54.17% |
| Inventory | 8 | 8 | -55.56% |
| Average Days on Market | 57 | 57 | -39.36% |
| Benchmark Price | 612,600 | 612,600 | 0.00% |
| Average Price | 914,543 | 914,543 | 83.03% |
| Median Price | 780,000 | 780,000 | 68.10% |
Oakridge Detached Homes
| Jan-22 | YTD* | Y/Y% † | |
|---|---|---|---|
| Sales | 2 | 2 | |
| New Listings | 2 | 2 | |
| Sales to New Listings Ratio | 100.00% | 100.00% | |
| Inventory | 3 | 3 | |
| Average Days on Market | 10 | 10 | |
| Benchmark Price | 660,900 | 660,900 | |
| Average Price | 746,500 | 746,500 | |
| Median Price | 746,500 | 746,500 |
Tuscany Detached Homes
| Jan-22 | YTD* | Y/Y% † | |
|---|---|---|---|
| Sales | 14 | 14 | -17.65% |
| New Listings | 20 | 20 | -25.93% |
| Sales to New Listings Ratio | 70.00% | 70.00% | 7.04% |
| Inventory | 7 | 7 | -66.67% |
| Average Days on Market | 6 | 6 | -79.31% |
| Benchmark Price | 539,100 | 539,100 | 0.00% |
| Average Price | 642,900 | 642,900 | 17.58% |
| Median Price | 590,000 | 590,000 | 14.56% |
Vista Heights Detached Homes
| Jan-22 | YTD* | Y/Y% † | |
|---|---|---|---|
| Sales | 4 | 4 | |
| New Listings | 1 | 1 | |
| Sales to New Listings Ratio | 400.00% | 400.00% | |
| Inventory | 2 | 2 | |
| Average Days on Market | 64 | 64 | |
| Benchmark Price | 394,300 | 394,300 | |
| Average Price | 417,425 | 417,425 | |
| Median Price | 406,875 | 406,875 |
Nolan Hill Detached Homes
| Jan-22 | YTD* | Y/Y% † | |
|---|---|---|---|
| Sales | 7 | 7 | |
| New Listings | 6 | 6 | |
| Sales to New Listings Ratio | 116.67% | 116.67% | |
| Inventory | 3 | 3 | |
| Average Days on Market | 23 | 23 | |
| Benchmark Price | 529,900 | 529,900 | |
| Average Price | 695,786 | 695,786 | |
| Median Price | 705,000 | 705,000 |
January 2022 Total Sales in Calgary
| Jan-22 | YTD* | Y/Y% † | |
|---|---|---|---|
| Sales | 2,009 | 2,009 | 66.45% |
| New Listings | 2,476 | 2,476 | 10.04% |
| Sales to New Listings Ratio | 81.14% | 81.14% | 27.50% |
| Inventory | 2,621 | 2,621 | -35.11% |
| Average Days on Market | 44 | 44 | -22.81% |
| Benchmark Price | 472,300 | 472,300 | 0.00% |
| Average Price | 510,701 | 510,701 | 8.19% |
| Median Price | 466,000 | 466,000 | 11.22% |
City Centre Calgary Statistics
| Jan-22 | YTD* | Y/Y% † | |
|---|---|---|---|
| Sales | 396 | 396 | 50.00% |
| New Listings | 650 | 650 | -1.81% |
| Sales to New Listings Ratio | 60.92% | 60.92% | 21.04% |
| Inventory | 1,037 | 1,037 | -27.99% |
| Average Days on Market | 60 | 60 | -11.76% |
| Benchmark Price | 501,300 | 501,300 | 0.00% |
| Average Price | 608,677 | 608,677 | 7.97% |
| Median Price | 545,000 | 545,000 | 7.65% |
North Calgary Statistics
| Jan-22 | YTD* | Y/Y% † | |
|---|---|---|---|
| Sales | 237 | 237 | 85.16% |
| New Listings | 266 | 266 | 22.58% |
| Sales to New Listings Ratio | 89.10% | 89.10% | 30.11% |
| Inventory | 187 | 187 | -46.72% |
| Average Days on Market | 33 | 33 | -44.07% |
| Benchmark Price | 433,900 | 433,900 | 0.00% |
| Average Price | 488,381 | 488,381 | 16.57% |
| Median Price | 475,000 | 475,000 | 15.85% |
Northeast Calgary Statistics
| Jan-22 | YTD* | Y/Y% † | |
|---|---|---|---|
| Sales | 311 | 311 | 132.09% |
| New Listings | 315 | 315 | 47.20% |
| Sales to New Listings Ratio | 98.73% | 98.73% | 36.11% |
| Inventory | 234 | 234 | -35.89% |
| Average Days on Market | 42 | 42 | -22.22% |
| Benchmark Price | 376,800 | 376,800 | 0.00% |
| Average Price | 398,877 | 398,877 | 20.31% |
| Median Price | 393,500 | 393,500 | 17.81% |
East Calgary Statistics
| Jan-22 | YTD* | Y/Y% † | |
|---|---|---|---|
| Sales | 69 | 69 | 72.50% |
| New Listings | 75 | 75 | 8.70% |
| Sales to New Listings Ratio | 92.00% | 92.00% | 34.03% |
| Inventory | 83 | 83 | -9.78% |
| Average Days on Market | 47 | 47 | -2.08% |
| Benchmark Price | 325,000 | 325,000 | 0.00% |
| Average Price | 324,828 | 324,828 | 25.75% |
| Median Price | 332,000 | 332,000 | 21.83% |
Southeast Calgary Statistics
| Jan-22 | YTD* | Y/Y% † | |
|---|---|---|---|
| Sales | 248 | 248 | 54.04% |
| New Listings | 304 | 304 | 24.59% |
| Sales to New Listings Ratio | 81.58% | 81.58% | 15.60% |
| Inventory | 213 | 213 | -41.48% |
| Average Days on Market | 33 | 33 | -44.07% |
| Benchmark Price | 478,800 | 478,800 | 0.00% |
| Average Price | 493,002 | 493,002 | 12.21% |
| Median Price | 468,725 | 468,725 | 15.73% |
South Calgary Statistics
| Jan-22 | YTD* | Y/Y% † | |
|---|---|---|---|
| Sales | 309 | 309 | 42.40% |
| New Listings | 379 | 379 | 9.54% |
| Sales to New Listings Ratio | 81.53% | 81.53% | 18.81% |
| Inventory | 329 | 329 | -35.36% |
| Average Days on Market | 33 | 33 | -29.79% |
| Benchmark Price | 458,200 | 458,200 | 0.00% |
| Average Price | 473,023 | 473,023 | 8.06% |
| Median Price | 490,000 | 490,000 | 18.36% |
West Calgary Statistics
| Jan-22 | YTD* | Y/Y% † | |
|---|---|---|---|
| Sales | 230 | 230 | 67.88% |
| New Listings | 232 | 232 | -11.45% |
| Sales to New Listings Ratio | 99.14% | 99.14% | 46.85% |
| Inventory | 277 | 277 | -46.11% |
| Average Days on Market | 50 | 50 | -19.35% |
| Benchmark Price | 572,900 | 572,900 | 0.00% |
| Average Price | 610,464 | 610,464 | -2.29% |
| Median Price | 600,000 | 600,000 | 4.53% |
Northwest Calgary Statistics
| Jan-22 | YTD* | Y/Y% † | |
|---|---|---|---|
| Sales | 208 | 208 | 65.08% |
| New Listings | 246 | 246 | 8.37% |
| Sales to New Listings Ratio | 84.55% | 84.55% | 29.04% |
| Inventory | 241 | 241 | -38.05% |
| Average Days on Market | 46 | 46 | -9.80% |
| Benchmark Price | 532,900 | 532,900 | 0.00% |
| Average Price | 545,969 | 545,969 | 12.42% |
| Median Price | 557,500 | 557,500 | 23.00% |
Airdrie Real Estate Statistics
"Persistently tight market conditions continue to place upward pressure on prices. In January, the total residential benchmark price rose by nearly three per cent over last month to $408,900. Most of the increase was due to significant gains recorded for both " - Calgary Real Estate Board
| Jan-22 | YTD* | Y/Y% † | |
|---|---|---|---|
| Sales | 145 | 145 | 40.78% |
| New Listings | 159 | 159 | 6.71% |
| Sales to New Listings Ratio | 91.19% | 91.19% | 22.06% |
| Inventory | 103 | 103 | -57.44% |
| Average Days on Market | 22 | 22 | -64.52% |
| Benchmark Price | 408,900 | 408,900 | 0.00% |
| Average Price | 467,456 | 467,456 | 20.34% |
| Median Price | 460,000 | 460,000 | 17.95% |
Calgary Detached Homes Statistics
| Jan-22 | YTD* | Y/Y% † | |
|---|---|---|---|
| Sales | 1,148 | 1,148 | 56.62% |
| New Listings | 1,295 | 1,295 | 16.25% |
| Sales to New Listings Ratio | 88.65% | 88.65% | 22.85% |
| Inventory | 895 | 895 | -46.85% |
| Average Days on Market | 33 | 33 | -37.74% |
| Benchmark Price | 559,800 | 559,800 | 0.00% |
| Average Price | 624,161 | 624,161 | 11.62% |
| Median Price | 570,000 | 570,000 | 18.26% |
Calgary Semi-Detached Homes Statistics
| Jan-22 | YTD* | Y/Y% † | |
|---|---|---|---|
| Sales | 199 | 199 | 42.14% |
| New Listings | 267 | 267 | 25.94% |
| Sales to New Listings Ratio | 74.53% | 74.53% | 8.49% |
| Inventory | 242 | 242 | -29.86% |
| Average Days on Market | 35 | 35 | -40.68% |
| Benchmark Price | 439,900 | 439,900 | 0.00% |
| Average Price | 558,094 | 558,094 | 16.61% |
| Median Price | 510,000 | 510,000 | 31.53% |
Calgary Row Home Statistics
| Jan-22 | YTD* | Y/Y% † | |
|---|---|---|---|
| Sales | 305 | 305 | 103.33% |
| New Listings | 363 | 363 | -2.42% |
| Sales to New Listings Ratio | 84.02% | 84.02% | 43.70% |
| Inventory | 422 | 422 | -39.37% |
| Average Days on Market | 58 | 58 | -13.43% |
| Benchmark Price | 305,600 | 305,600 | 0.00% |
| Average Price | 336,638 | 336,638 | 11.34% |
| Median Price | 314,000 | 314,000 | 8.28% |
Calgary Condominium Statistics
| Jan-22 | YTD* | Y/Y% † | |
|---|---|---|---|
| Sales | 357 | 357 | 94.02% |
| New Listings | 551 | 551 | -0.18% |
| Sales to New Listings Ratio | 64.79% | 64.79% | 31.46% |
| Inventory | 1,062 | 1,062 | -19.18% |
| Average Days on Market | 70 | 70 | 7.69% |
| Benchmark Price | 251,200 | 251,200 | 0.00% |
| Average Price | 268,141 | 268,141 | 3.93% |
| Median Price | 234,000 | 234,000 | 6.36% |
*Year-To-Date as of February 1, 2022
†Year-To-Date, year over year percent change.
‡Calgary Census Metropolitan Area includes Calgary, Airdrie, and Rocky View


Free Calgary Real Estate Monthly Market Report
If you're looking for the latest sales and statistics for your community in Calgary or one that you're interested in moving to, please fill out the form below and let us know which community you need a monthly market report set up for.
Leave A Comment