November 2021 Calgary Real Estate Statistics Recap
Back in September sales were STRONG and they're continuing to be red hot, the city of Calgary and surrounding areas markets continue to stay hot and in demand, with inventory continuing to battle the fast paced sales on the market.
In November we saw over 2,000 sales across all property types, this is just shy of the previous record which was set in 2005. While some economists believe this to be d riven by what's believed to be impending interest rate increases, the truth is, we really can't say for certain that this is the leading cause. Our country continues to open up for immigration, major cities in provinces like Ontario and British Columbia continue to demand housing prices and costs that are unachievable for many, while Calgary continues to grow and diversify as the fourth biggest major metro in Canada.
SALES OUTPACED NEW LISTINGS THIS MONTH. Under 2,000 new listings this month were brought onto the market, these new listings were outpaced by sales with over 2,100. The real estate market in Calgary (November 2021) is demonstrating persistent demand sellers continue to see an increase in the benchmark price from previous years, typically we see a slow down in inventory in November leading into December accompanied by a similar decrease in sales, this hasn't been the case this year.
To give some perspective, our team just listed a luxury home (we may take a second to humble brag about the marketing we did for this home, driving over 50,000+ views across our social platforms and generating tons of showings) ultimately getting it sold and firm in just 5 days FOR FULL LIST PRICE. However, we know this isn't common. Currently Mahogany average over 60 days on the market across the board. Luxury homes typically take longer to sell as there are less buyers in the market, but with low inventory, and higher demand from buyers out of province who (in the GTA for example) are dealing with benchmark prices for all home types (detached, condo, townhouse etc) in October of this year was $1,128,600 which is just shy of being 2.5X that of Calgary's total benchmark price which came in under $461,000 for November 2021.
November Calgary Real Estate Statistics
For optimal viewing, click the infographic to view as a PDF
Latest Combined Calgary Real Estate Statistics: November 2021
- Benchmark Price $461,000
- Inventory 3,922
- Sales to New Listings Ratio 106%
- Months of Inventory/Supply 1.86 Months of supply (Down 46.8% Y/Y)
Year to Date Calgary Real Estate Statistics: November 2021
- Benchmark Price $450,445
- Sales to New Listings Ratio 71%
- Months of Inventory/Supply 2.35 Months of supply (Down 46% Y/Y)
DOM = Number of Days on Market
As of November 30th 2021, the average number of days on market for all property types combined was 33 days (YTD) while the month of November saw an average DOM of 40.
MLS® Listings in Calgary (New)
As of November 30th 2021 the total number of new active listings in the city of Calgary added to the market was 1,526 and in total there have been 20,706 YTD
Homes Sold in Calgary November 2021
The total number of homes sold for the month of November in Calgary was 1,245 which represents a 41.00% increase Y/Y. The total sales for 2021 are 16,228 which represents a 73.10% increase Y/Y.
Average Real Estate Prices in Calgary
In November 2021 the average price for a detached home in the city of Calgary was $586,436
2021 Greater Calgary Regional Market Statistics
For best viewing, click the infographic to view as a PDF
Specific community spotlight real estate statistics
Discovery Ridge Detached Homes
| Nov-21 | YTD* | Y/Y% † | |
|---|---|---|---|
| Sales | 2 | 60 | 76.47% |
| New Listings | 4 | 83 | 18.57% |
| Sales to New Listings Ratio | 50.00% | 72.29% | 23.72% |
| Inventory | 6 | 10 | -37.50% |
| Average Days on Market | 26 | 35 | -47.76% |
| Benchmark Price | 954,100 | 917,872 | 0.00% |
| Average Price | 813,250 | 880,036 | -4.39% |
| Median Price | 813,250 | 830,000 | -5.68% |
Cranston Detached Homes
| Nov-21 | YTD* | Y/Y% † | |
|---|---|---|---|
| Sales | 27 | 403 | 67.22% |
| New Listings | 24 | 453 | 19.53% |
| Sales to New Listings Ratio | 112.50% | 88.96% | 25.37% |
| Inventory | 24 | 42 | -40.85% |
| Average Days on Market | 30 | 30 | -42.31% |
| Benchmark Price | 575,200 | 550,581 | 0.00% |
| Average Price | 556,317 | 581,346 | 14.30% |
| Median Price | 472,000 | 523,000 | 11.99% |
Hillhurst Detached Homes
| Nov-21 | YTD* | Y/Y% † | |
|---|---|---|---|
| Sales | 8 | 63 | 133.33% |
| New Listings | 4 | 95 | 41.79% |
| Sales to New Listings Ratio | 200.00% | 66.32% | 26.02% |
| Inventory | 7 | 17 | 21.43% |
| Average Days on Market | 52 | 51 | 41.67% |
| Benchmark Price | 616,100 | 602,118 | |
| Average Price | 814,475 | 886,914 | 18.87% |
| Median Price | 753,000 | 760,000 | 11.76% |
Oakridge Detached Homes
| Nov-21 | YTD* | Y/Y% † | |
|---|---|---|---|
| Sales | 7 | 68 | 74.36% |
| New Listings | 8 | 88 | 60.00% |
| Sales to New Listings Ratio | 87.50% | 77.27% | 6.36% |
| Inventory | 5 | 6 | -40.00% |
| Average Days on Market | 26 | 19 | -61.22% |
| Benchmark Price | 639,400 | 605,627 | |
| Average Price | 681,393 | 661,858 | 20.62% |
| Median Price | 695,000 | 602,600 | 11.80% |
Tuscany DETACHED HOMES
| Nov-21 | YTD* | Y/Y% † | |
|---|---|---|---|
| Sales | 14 | 338 | 52.94% |
| New Listings | 10 | 389 | 31.42% |
| Sales to New Listings Ratio | 140.00% | 86.89% | 12.23% |
| Inventory | 6 | 29 | -36.96% |
| Average Days on Market | 29 | 23 | -45.24% |
| Benchmark Price | 515,500 | 510,936 | 0.00% |
| Average Price | 634,821 | 583,792 | 11.61% |
| Median Price | 516,000 | 535,500 | 10.41% |
Vista Heights DETACHED HOMES
| Nov-21 | YTD* | Y/Y% † | |
|---|---|---|---|
| Sales | Insufficient Data | 14 | 75.00% |
| New Listings | Insufficient Data | 23 | 53.33% |
| Sales to New Listings Ratio | Insufficient Data | 60.87% | 7.54% |
| Inventory | Insufficient Data | 3 | 50.00% |
| Average Days on Market | Insufficient Data | 23 | -11.54% |
| Benchmark Price | Insufficient Data | 371,309 | 0.00% |
| Average Price | Insufficient Data | 414,589 | 2.64% |
| Median Price | Insufficient Data | 417,500 | 4.51% |
Nolan Hill DETACHED HOMES
| Nov-21 | YTD* | Y/Y% † | |
|---|---|---|---|
| Sales | 6 | 123 | 24.24% |
| New Listings | 6 | 141 | 17.50% |
| Sales to New Listings Ratio | 100.00% | 87.23% | 4.73% |
| Inventory | 3 | 11 | -52.17% |
| Average Days on Market | 23 | 25 | -60.32% |
| Benchmark Price | 496,500 | 479,645 | 0.00% |
| Average Price | 596,166 | 570,424 | 8.53% |
| Median Price | 573,500 | 545,504 | 5.51% |
SOUTHVIEW DETACHED HOMES
| Nov-21 | YTD* | Y/Y% † | |
|---|---|---|---|
| Sales | 4 | 29 | 81.25% |
| New Listings | 2 | 43 | 59.26% |
| Sales to New Listings Ratio | 200.00% | 67.44% | 8.18% |
| Inventory | 2 | 7 | 75.00% |
| Average Days on Market | 62 | 58 | 45.00% |
| Benchmark Price | 402,900 | 404,836 | 0.00% |
| Average Price | 348,375 | 384,517 | -1.48% |
| Median Price | 342,750 | 373,000 | 3.97% |
November 2021 Total Sales in Calgary
| Nov-21 | YTD* | Y/Y% † | |
|---|---|---|---|
| Sales | 2,110 | 25,953 | 73.60% |
| New Listings | 1,989 | 36,429 | 34.95% |
| Sales to New Listings Ratio | 106.08% | 71.24% | 15.86% |
| Inventory | 3,923 | 5,540 | -6.18% |
| Average Days on Market | 46 | 39 | -27.78% |
| Benchmark Price | 461,000 | 450,445 | 0.00% |
| Average Price | 491,160 | 493,885 | 7.68% |
| Median Price | 440,000 | 445,000 | 8.01% |
City Centre Calgary Statistics
| Nov-21 | YTD* | Y/Y% † | |
|---|---|---|---|
| Sales | 401 | 4,703 | 76.34% |
| New Listings | 463 | 8,723 | 24.58% |
| Sales to New Listings Ratio | 86.61% | 53.91% | 15.82% |
| Inventory | 1,406 | 1,888 | 3.74% |
| Average Days on Market | 62 | 53 | -15.87% |
| Benchmark Price | 498,700 | 497,081 | 0.00% |
| Average Price | 602,712 | 601,413 | 6.07% |
| Median Price | 500,000 | 525,000 | 7.14% |
North Calgary Statistics
| Nov-21 | YTD* | Y/Y% † | |
|---|---|---|---|
| Sales | 270 | 3,277 | 70.50% |
| New Listings | 223 | 4,061 | 39.55% |
| Sales to New Listings Ratio | 121.08% | 80.69% | 14.64% |
| Inventory | 306 | 502 | -12.70% |
| Average Days on Market | 40 | 35 | -32.69% |
| Benchmark Price | 416,200 | 404,872 | 0.00% |
| Average Price | 432,018 | 433,223 | 8.23% |
| Median Price | 430,000 | 430,000 | 7.50% |
Northeast Calgary Statistics
| Nov-21 | YTD* | Y/Y% † | |
|---|---|---|---|
| Sales | 273 | 2,736 | 96.55% |
| New Listings | 231 | 4,066 | 78.65% |
| Sales to New Listings Ratio | 118.18% | 67.29% | 6.13% |
| Inventory | 417 | 609 | 27.67% |
| Average Days on Market | 46 | 39 | -30.36% |
| Benchmark Price | 366,600 | 358,200 | 0.00% |
| Average Price | 379,814 | 369,705 | 12.44% |
| Median Price | 370,000 | 369,250 | 10.89% |
East Calgary Statistics
| Nov-21 | YTD* | Y/Y% † | |
|---|---|---|---|
| Sales | 73 | 742 | 75.83% |
| New Listings | 59 | 1,101 | 82.28% |
| Sales to New Listings Ratio | 123.73% | 67.39% | -2.48% |
| Inventory | 120 | 171 | 40.16% |
| Average Days on Market | 53 | 41 | -22.64% |
| Benchmark Price | 321,700 | 317,509 | 0.00% |
| Average Price | 282,602 | 295,649 | 11.22% |
| Median Price | 299,000 | 312,000 | 13.35% |
Southeast Calgary Statistics
| Nov-21 | YTD* | Y/Y% † | |
|---|---|---|---|
| Sales | 255 | 3,691 | 67.54% |
| New Listings | 243 | 4,344 | 26.32% |
| Sales to New Listings Ratio | 104.94% | 84.97% | 20.91% |
| Inventory | 331 | 486 | -27.89% |
| Average Days on Market | 38 | 33 | -36.54% |
| Benchmark Price | 465,800 | 450,209 | 0.00% |
| Average Price | 448,396 | 457,644 | 6.94% |
| Median Price | 425,000 | 430,000 | 7.50% |
South Calgary Statistics
| Nov-21 | YTD* | Y/Y% † | |
|---|---|---|---|
| Sales | 385 | 4,692 | 65.50% |
| New Listings | 351 | 5,833 | 32.81% |
| Sales to New Listings Ratio | 109.69% | 80.44% | 15.89% |
| Inventory | 504 | 696 | -18.12% |
| Average Days on Market | 37 | 33 | -34.00% |
| Benchmark Price | 445,200 | 432,563 | 0.00% |
| Average Price | 470,560 | 466,738 | 8.68% |
| Median Price | 460,000 | 445,000 | 8.54% |
West Calgary Statistics
| Nov-21 | YTD* | Y/Y% † | |
|---|---|---|---|
| Sales | 201 | 2,791 | 77.54% |
| New Listings | 207 | 3,947 | 24.63% |
| Sales to New Listings Ratio | 97.10% | 70.71% | 21.07% |
| Inventory | 457 | 620 | -16.10% |
| Average Days on Market | 51 | 41 | -30.51% |
| Benchmark Price | 568,900 | 552,081 | 0.00% |
| Average Price | 618,030 | 620,038 | 7.26% |
| Median Price | 574,000 | 586,825 | 8.95% |
Northwest Calgary Statistics
| Nov-21 | YTD* | Y/Y% † | |
|---|---|---|---|
| Sales | 244 | 3,269 | 69.82% |
| New Listings | 202 | 4,250 | 34.32% |
| Sales to New Listings Ratio | 120.79% | 76.92% | 16.08% |
| Inventory | 365 | 545 | -13.08% |
| Average Days on Market | 46 | 35 | -30.00% |
| Benchmark Price | 513,500 | 504,354 | 0.00% |
| Average Price | 522,531 | 517,494 | 7.14% |
| Median Price | 514,500 | 505,000 | 8.60% |
Airdrie Real Estate Statistics
| Nov-21 | YTD* | Y/Y% † | |
|---|---|---|---|
| Sales | 144 | 2,183 | 65.63% |
| New Listings | 122 | 2,462 | 33.73% |
| Sales to New Listings Ratio | 118.03% | 88.67% | 17.08% |
| Inventory | 153 | 268 | -30.21% |
| Average Days on Market | 40 | 33 | -45.00% |
| Benchmark Price | 395,100 | 379,300 | 0.00% |
| Average Price | 388,600 | 406,144 | 7.56% |
| Median Price | 399,950 | 404,000 | 10.31% |
Calgary Detached Homes Statistics
| Detached | Nov-21 | YTD* | Y/Y% † |
|---|---|---|---|
| Sales | 1,246 | 16,034 | 73.70% |
| New Listings | 1,052 | 20,547 | 39.17% |
| Sales to New Listings Ratio | 118.44% | 78.04% | 15.52% |
| Inventory | 1,526 | 2,476 | -14.27% |
| Average Days on Market | 40 | 32 | -36.00% |
| Benchmark Price | 542,600 | 527,863 | 0.00% |
| Average Price | 585,922 | 585,284 | 8.46% |
| Median Price | 520,000 | 516,000 | 9.32% |
Calgary Semi-Detached Homes Statistics
| Semi-Detached | Nov-21 | YTD* | Y/Y% † |
|---|---|---|---|
| Sales | 211 | 2,436 | 58.70% |
| New Listings | 172 | 3,337 | 25.07% |
| Sales to New Listings Ratio | 122.67% | 73.00% | 15.47% |
| Inventory | 316 | 477 | -19.43% |
| Average Days on Market | 49 | 39 | -36.07% |
| Benchmark Price | 429,800 | 419,345 | 0.00% |
| Average Price | 499,599 | 499,059 | 8.80% |
| Median Price | 425,000 | 418,000 | 11.47% |
Calgary Row Home Statistics
| Row | Nov-21 | YTD* | Y/Y% † |
|---|---|---|---|
| Sales | 321 | 3,649 | 84.67% |
| New Listings | 304 | 5,335 | 36.94% |
| Sales to New Listings Ratio | 105.59% | 68.40% | 17.68% |
| Inventory | 664 | 898 | -0.66% |
| Average Days on Market | 46 | 46 | -23.33% |
| Benchmark Price | 299,100 | 294,518 | 0.00% |
| Average Price | 330,270 | 326,966 | 5.26% |
| Median Price | 305,000 | 300,415 | 4.95% |
Calgary Condominium Statistics
| Apartment | Nov-21 | YTD* | Y/Y% † |
|---|---|---|---|
| Sales | 332 | 3,834 | 73.64% |
| New Listings | 461 | 7,210 | 27.25% |
| Sales to New Listings Ratio | 72.02% | 53.18% | 14.21% |
| Inventory | 1,417 | 1,687 | 10.99% |
| Average Days on Market | 69 | 60 | -9.09% |
| Benchmark Price | 251,700 | 251,309 | 0.00% |
| Average Price | 285,713 | 267,230 | 5.73% |
| Median Price | 230,000 | 230,000 | 2.22% |
†Year-To-Date, year over year percent change.
‡Calgary Census Metropolitan Area includes Calgary, Airdrie, and Rocky View
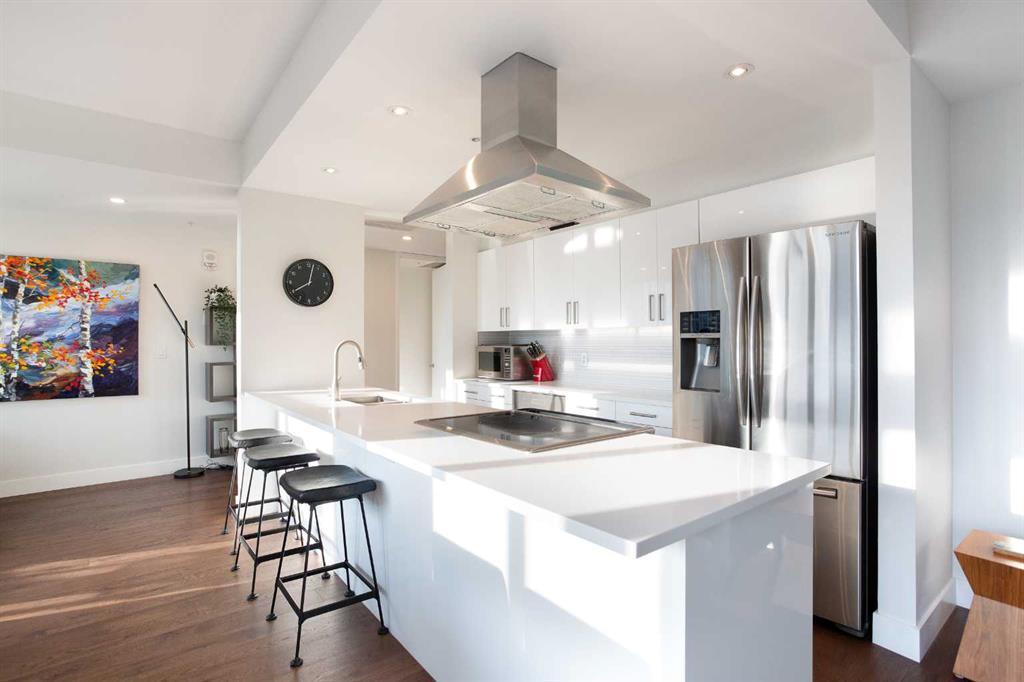
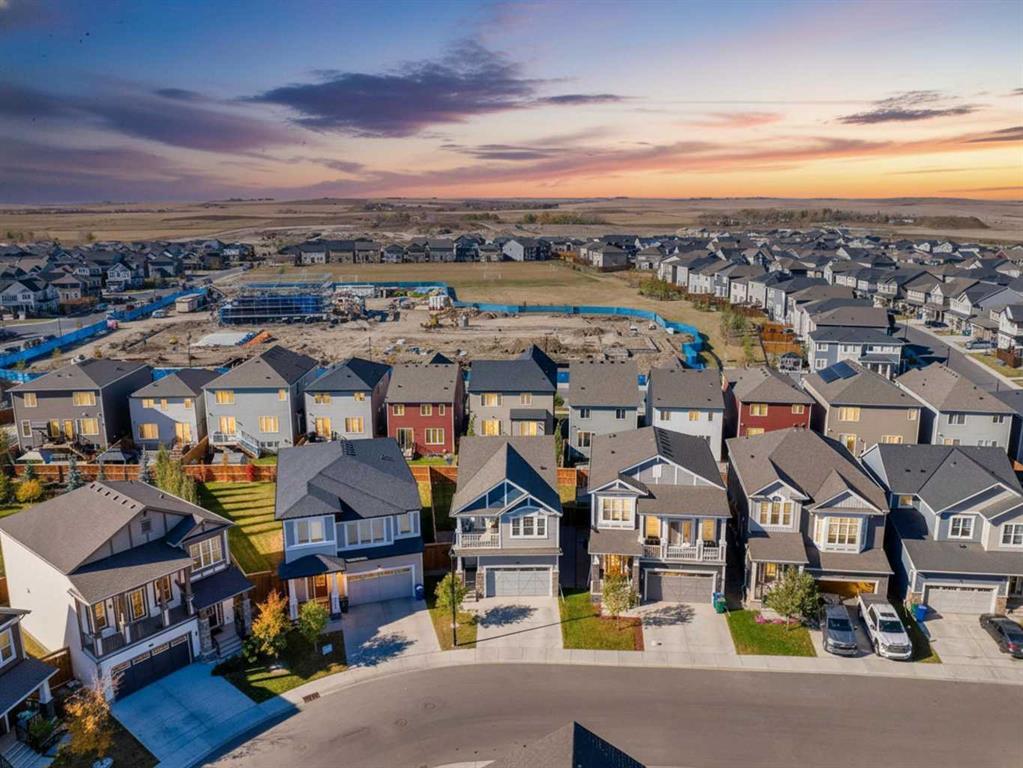
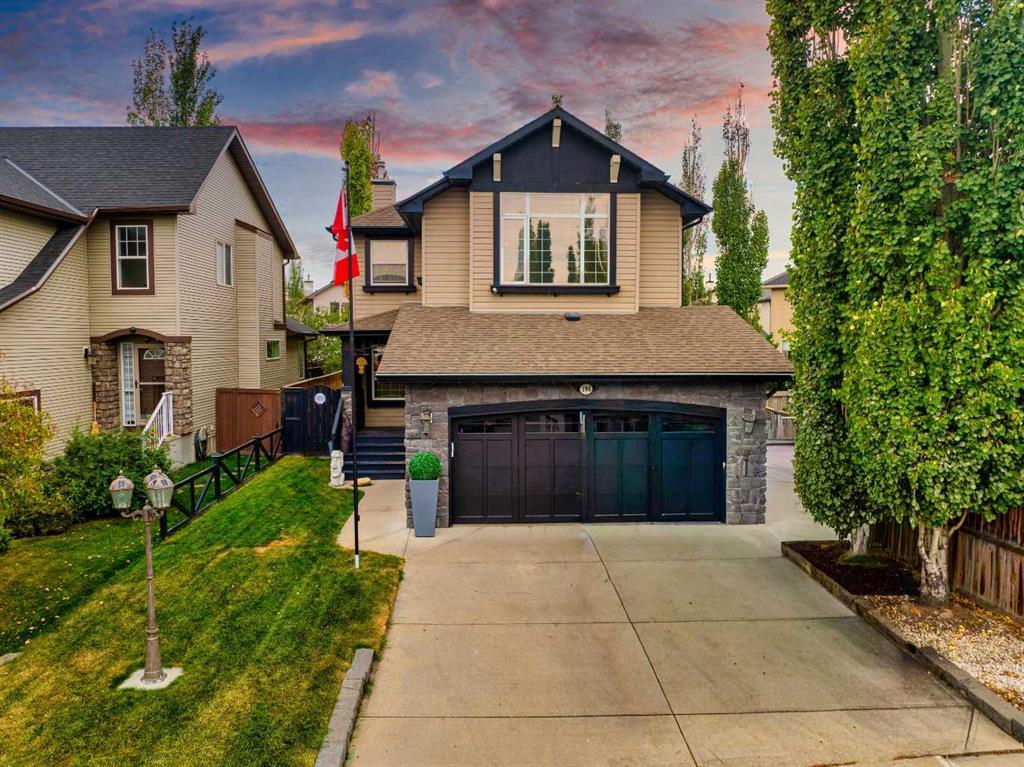
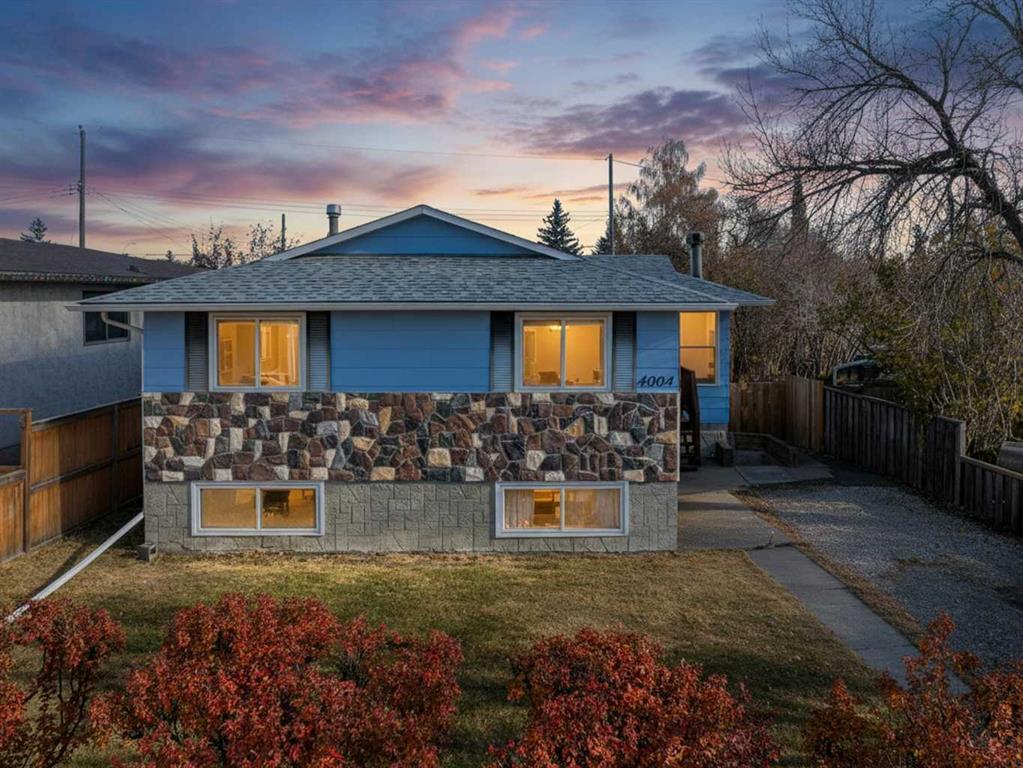
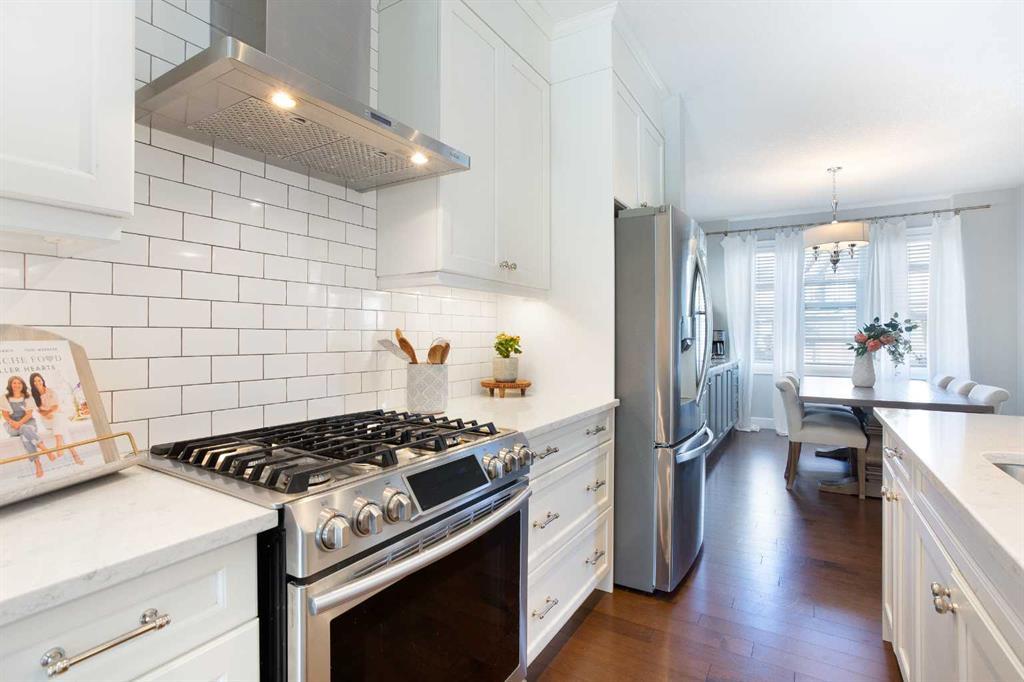
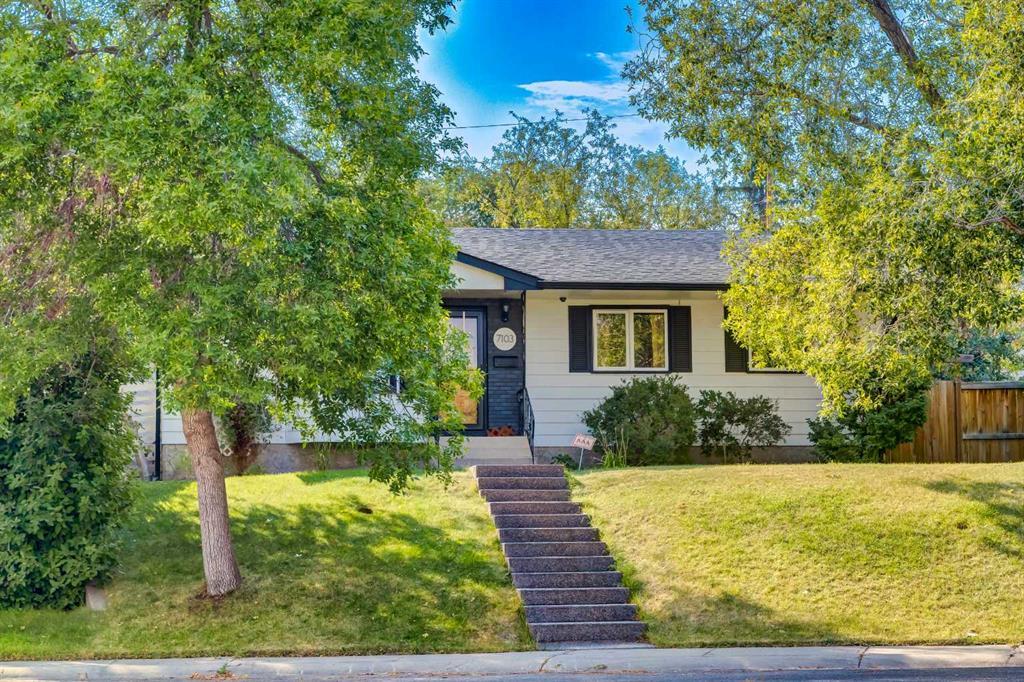
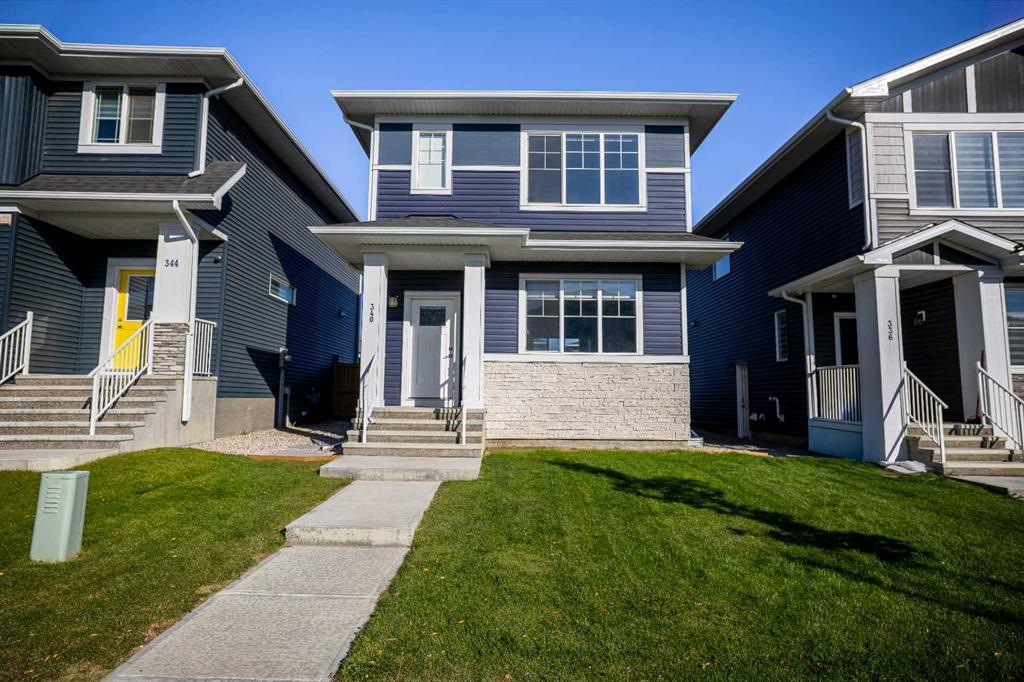
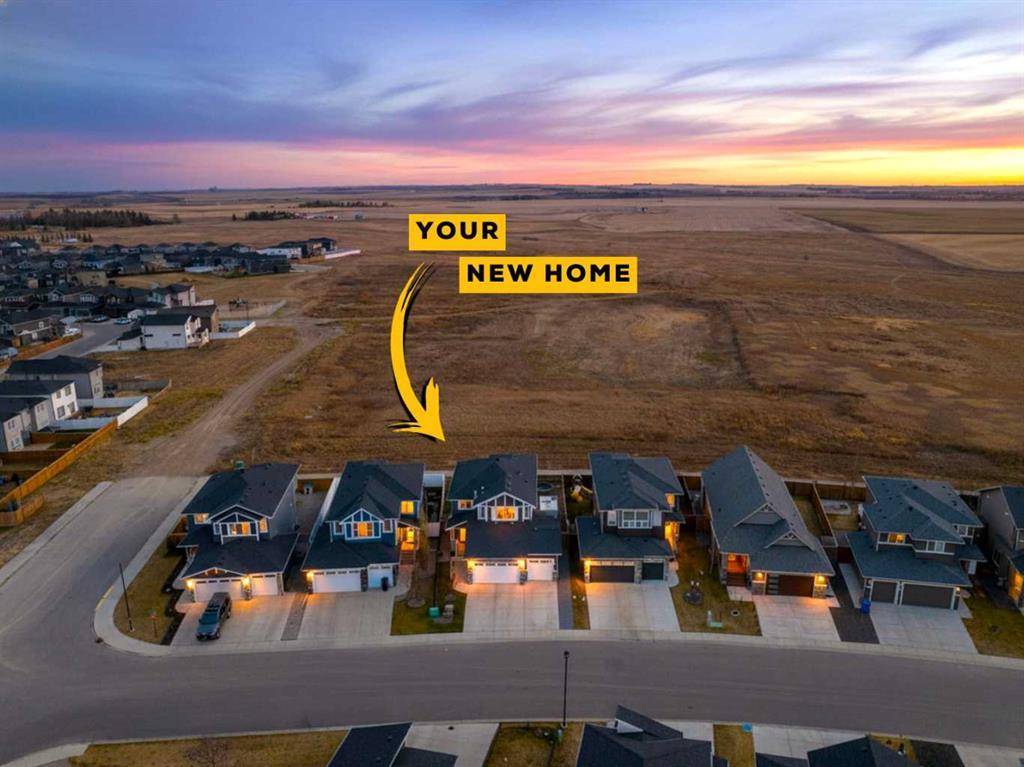
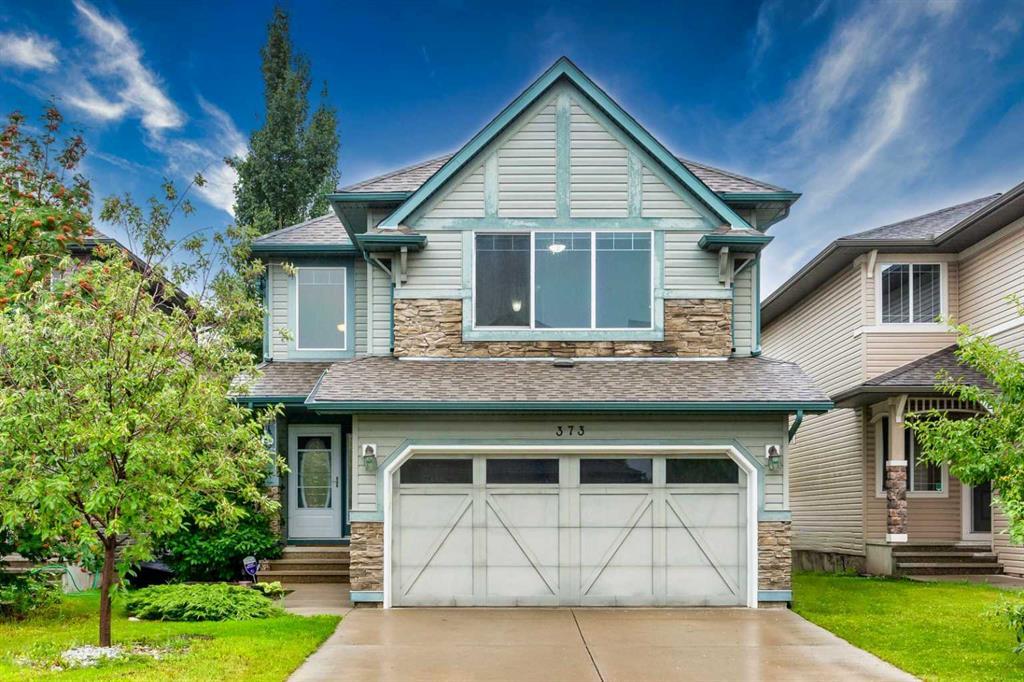
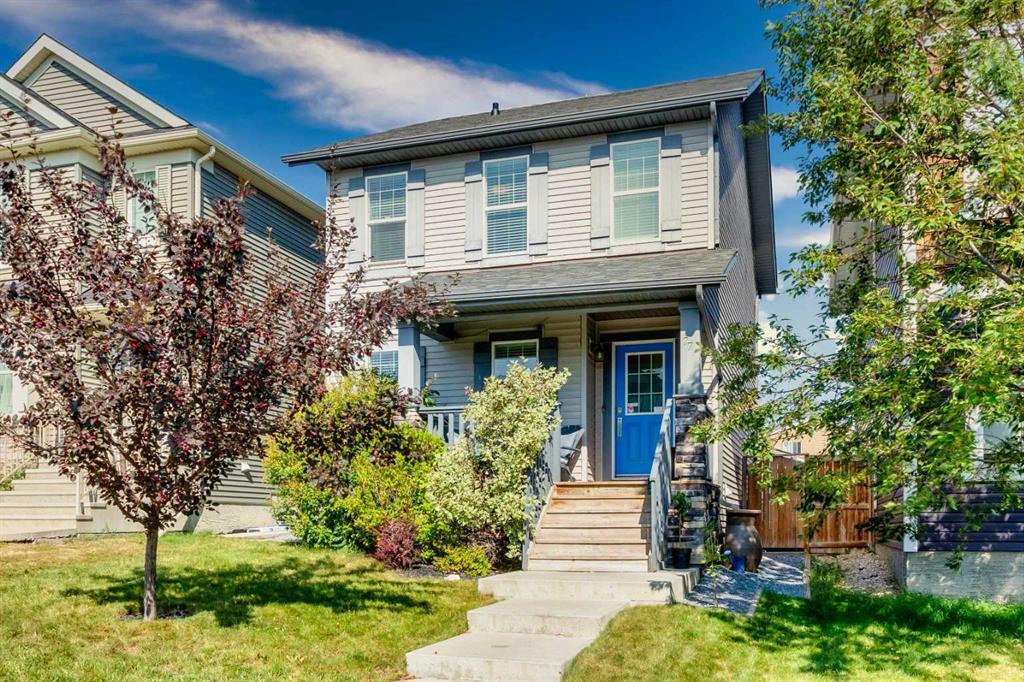
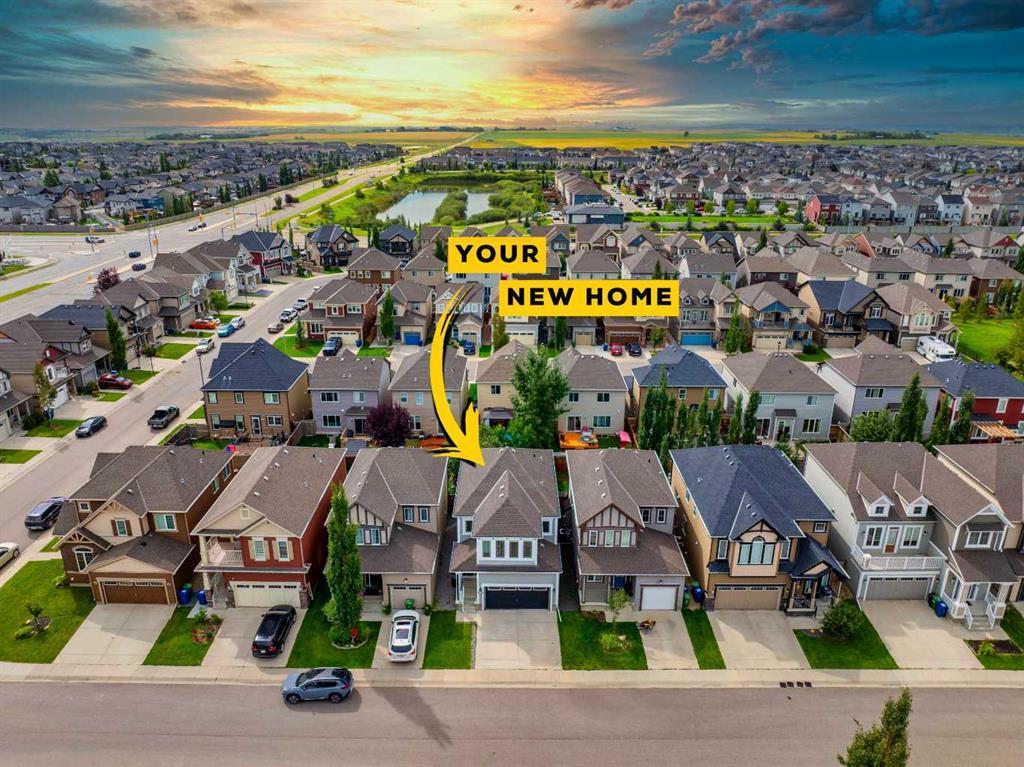
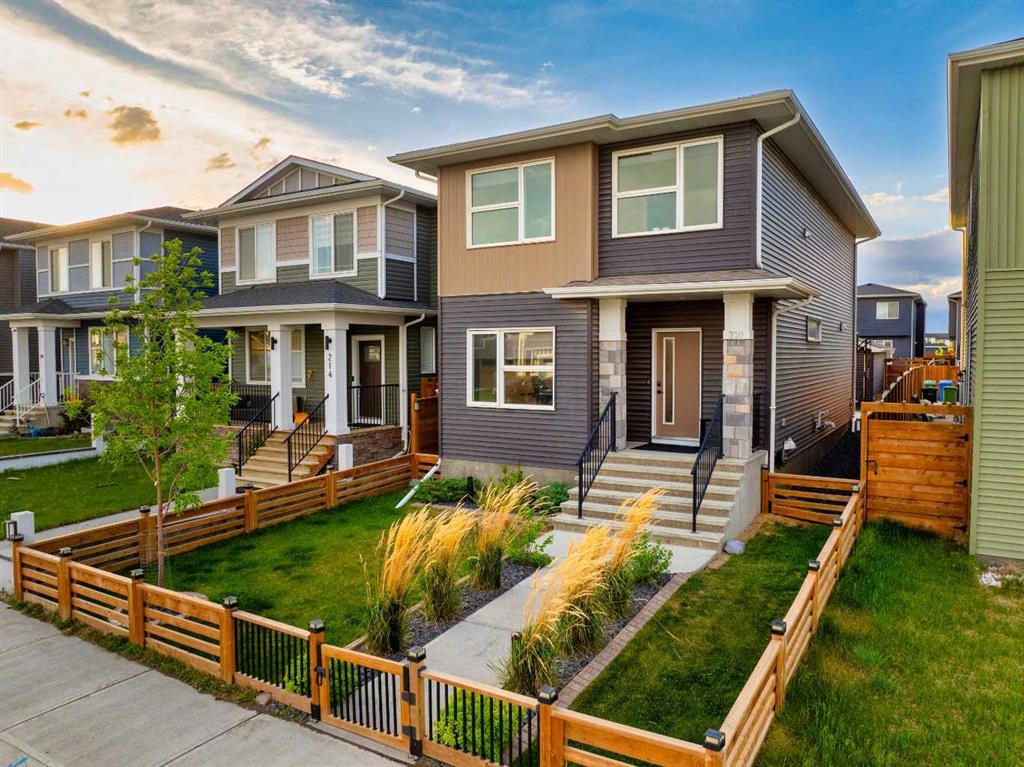
Our Featured Listings
Free Calgary Real Estate Monthly Market Report
If you're looking for the latest sales and statistics for your community in Calgary or one that you're interested in moving to, please fill out the form below and let us know which community you need a monthly market report set up for.






Leave A Comment