September 2021 Calgary Real Estate Statistics Recap
The headline for September real estate in Calgary? SALES REMAIN STRONG. 
The record for sales in September was set back in 2005 when Calgary witnessed some of it's most significant increases in value in the housing market. This month nearly reached this total with a combined (all property types) of 2,162 sales! This represents a year of year increase of over 26.7%.
Chief economist Ann-Marie Lurie of the Calgary Real Estate Board (CREB®) said “While sales activity in the fall tends to be slower than in the spring months, the continued strong sales are likely being driven by consumers who were unable to transact earlier in the year when supply levels had not yet adjusted to demand,”
Right now we're seeing benchmark prices sitting over 8% total from last year with detached home prices leading the way at an over 10% increase year over year. The lack of supply for detached homes continues to drive prices up and keep demand high, the abundance of supply in the apartment / condominium market is reflected for this market with more modest gains at just 1.2% year over year, and with areas like the city centre being one of the most dense spots for apartments, it's no surprise this zone in Calgary is seeing the lowest gains at just 4.4% year over year while areas like the north east, north west, west, south, and south east, all seeing gains of over 9% year over year.
September Calgary Real Estate Statistics
For optimal viewing, click the infographic to view as a PDF
Latest Combined Calgary Real Estate Statistics: September 2021
- Benchmark Price $457,900
- Inventory 5,607
- Sales to New Listings Ratio 74%
- Months of Inventory/Supply 2.59 Months of supply (Down 29.2% Y/Y)
Year to Date Calgary Real Estate Statistics: September 2021
- Benchmark Price $448,200
- Sales to New Listings Ratio 68%
- Months of Inventory/Supply 2.4 Months of supply (Down 48% Y/Y)
DOM = Number of Days on Market
As of September 31st 2021, the average number of days on market for all property types combined was 38 days (YTD) while the month of September saw an average DOM of 44.
MLS® Listings in Calgary (New)
As of September 31st 2021 the total number of new active listings in the city of Calgary added to the market was 2,907 and in total there have been 32,383 YTD
Homes Sold in Calgary September 2021
The total number of homes sold for the month of September in Calgary was 2,159 this represents a 26.55% increase Y/Y. The total sales for 2021 are 21,964 which represents a 82.56% increase Y/Y.
Average Real Estate Prices in Calgary
In September 2021 the average price for a detached home in the city of Calgary was $581,169
2021 Greater Calgary Regional Market Statistics
For best viewing, click the infographic to view as a PDF
September 2021 Total Sales in Calgary
| Sep-21 | YTD* | Y/Y% † | |
|---|---|---|---|
| Sales | 2,162 | 21,671 | 84.43% |
| New Listings | 2,907 | 31,940 | 40.04% |
| Sales to New Listings Ratio | 74.37% | 67.85% | 16.33% |
| Inventory | 5,608 | 5,790 | -3.69% |
| Average Days on Market | 44 | 38 | -30.91% |
| Benchmark Price | Insufficient Data | Insufficient Data | Insufficient Data |
| Average Price | 476,041 | 495,186 | 8.44% |
| Median Price | 425,000 | 445,000 | 8.54% |
City Centre Calgary Statistics
| Sep-21 | YTD* | Y/Y% † | |
|---|---|---|---|
| Sales | 2,162 | 21,671 | 84.43% |
| New Listings | 2,907 | 31,940 | 40.04% |
| Sales to New Listings Ratio | 74.37% | 67.85% | 16.33% |
| Inventory | 5,608 | 5,790 | -3.69% |
| Average Days on Market | 44 | 38 | -30.91% |
| Benchmark Price | Insufficient Data | Insufficient Data | Insufficient Data |
| Average Price | 476,041 | 495,186 | 8.44% |
| Median Price | 425,000 | 445,000 | 8.54% |
North Calgary Statistics
| Sep-21 | YTD* | Y/Y% † | |
|---|---|---|---|
| Sales | 293 | 2,725 | 79.39% |
| New Listings | 327 | 3,575 | 43.92% |
| Sales to New Listings Ratio | 89.60% | 76.22% | 15.07% |
| Inventory | 511 | 534 | -11.00% |
| Average Days on Market | 40 | 34 | -34.62% |
| Benchmark Price | Insufficient Data | Insufficient Data | Insufficient Data |
| Average Price | 412,286 | 432,822 | 9.38% |
| Median Price | 412,000 | 428,000 | 8.49% |
Northeast Calgary Statistics
| Sep-21 | YTD* | Y/Y% † | |
|---|---|---|---|
| Sales | 281 | 2,203 | 103.98% |
| New Listings | 311 | 3,533 | 91.49% |
| Sales to New Listings Ratio | 90.35% | 62.35% | 3.81% |
| Inventory | 678 | 637 | 31.34% |
| Average Days on Market | 40 | 38 | -32.14% |
| Benchmark Price | Insufficient Data | Insufficient Data | Insufficient Data |
| Average Price | 363,647 | 367,247 | 11.96% |
| Median Price | 365,000 | 368,200 | 10.90% |
East Calgary Statistics
| Sep-21 | YTD* | Y/Y% † | |
|---|---|---|---|
| Sales | 58 | 579 | 74.40% |
| New Listings | 114 | 970 | 96.75% |
| Sales to New Listings Ratio | 50.88% | 59.69% | -7.65% |
| Inventory | 214 | 178 | 45.90% |
| Average Days on Market | 52 | 38 | -30.91% |
| Benchmark Price | Insufficient Data | Insufficient Data | Insufficient Data |
| Average Price | 280,623 | 296,946 | 12.89% |
| Median Price | 296,250 | 313,000 | 13.82% |
Southeast Calgary Statistics
| Sep-21 | YTD* | Y/Y% † | |
|---|---|---|---|
| Sales | 268 | 3,135 | 79.35% |
| New Listings | 338 | 3,811 | 28.71% |
| Sales to New Listings Ratio | 79.29% | 82.26% | 23.23% |
| Inventory | 472 | 512 | -27.38% |
| Average Days on Market | 40 | 33 | -36.54% |
| Benchmark Price | Insufficient Data | Insufficient Data | Insufficient Data |
| Average Price | 446,999 | 458,026 | 6.95% |
| Median Price | 414,875 | 430,000 |
South Calgary Statistics
| Sep-21 | YTD* | Y/Y% † | |
|---|---|---|---|
| Sales | 384 | 3,940 | 76.29% |
| New Listings | 465 | 5,058 | 34.88% |
| Sales to New Listings Ratio | 82.58% | 77.90% | 18.30% |
| Inventory | 704 | 724 | -17.63% |
| Average Days on Market | 35 | 32 | -37.25% |
| Benchmark Price | Insufficient Data | Insufficient Data | Insufficient Data |
| Average Price | 451,366 | 466,461 | 8.72% |
| Median Price | 432,250 | 443,800 | 8.24% |
West Calgary Statistics
| Sep-21 | YTD* | Y/Y% † | |
|---|---|---|---|
| Sales | 221 | 2,381 | 92.64% |
| New Listings | 304 | 3,473 | 29.25% |
| Sales to New Listings Ratio | 72.70% | 68.56% | 22.56% |
| Inventory | 581 | 647 | -13.73% |
| Average Days on Market | 50 | 40 | -32.20% |
| Benchmark Price | Insufficient Data | Insufficient Data | Insufficient Data |
| Average Price | 606,363 | 623,755 | 9.64% |
| Median Price | 563,000 | 588,000 | 10.73% |
Northwest Calgary Statistics
| Sep-21 | YTD* | Y/Y% † | |
|---|---|---|---|
| Sales | 293 | 2,767 | 81.20% |
| New Listings | 341 | 3,776 | 39.44% |
| Sales to New Listings Ratio | 85.92% | 73.28% | 16.89% |
| Inventory | 559 | 573 | -10.89% |
| Average Days on Market | 38 | 33 | -34.00% |
| Benchmark Price | Insufficient Data | Insufficient Data | Insufficient Data |
| Average Price | 509,639 | 516,743 | 7.03% |
| Median Price | 496,800 | 504,000 | 8.39% |
Airdrie Real Estate Statistics
| Sep-21 | YTD* | Y/Y% † | |
|---|---|---|---|
| Sales | 166 | 1,860 | 76.14% |
| New Listings | 179 | 2,184 | 36.67% |
| Sales to New Listings Ratio | 92.74% | 85.16% | 19.08% |
| Inventory | 237 | 288 | -28.71% |
| Average Days on Market | 30 | 33 | -46.77% |
| Benchmark Price | Insufficient Data | Insufficient Data | Insufficient Data |
| Average Price | 412,026 | 409,752 | 10.19% |
| Median Price | 421,750 | 406,000 | 11.31% |
Calgary Detached Homes Statistics
| Detached Homes | Sep-21 | YTD* | Y/Y% † |
|---|---|---|---|
| Sales | 1,268 | 13,464 | 86.71% |
| New Listings | 1,562 | 18,145 | 44.62% |
| Sales to New Listings Ratio | 81.18% | 74.20% | 16.73% |
| Inventory | 2,496 | 2,626 | -11.79% |
| Average Days on Market | 36 | 31 | -38.00% |
| Average Price | 581,104 | 586,900 | 9.16% |
| Median Price | 505,000 | 516,456 | 9.88% |
Calgary Semi-Detached Homes Statistics
| Semi Detached | Sep-21 | YTD* | Y/Y% † |
|---|---|---|---|
| Sales | 210 | 2,005 | 66.11% |
| New Listings | 296 | 2,939 | 29.70% |
| Sales to New Listings Ratio | 70.95% | 68.22% | 14.95% |
| Inventory | 517 | 499 | -18.33% |
| Average Days on Market | 42 | 38 | -38.71% |
| Average Price | 464,602 | 500,809 | 9.59% |
| Median Price | 400,000 | 420,000 | 12.75% |
Calgary Row Home Statistics
| ROW | Sep-21 | YTD* | Y/Y% † |
|---|---|---|---|
| Sales | 318 | 3,057 | 94.96% |
| New Listings | 417 | 4,638 | 40.72% |
| Sales to New Listings Ratio | 76.26% | 65.91% | 18.34% |
| Inventory | 876 | 933 | 2.19% |
| Average Days on Market | 52 | 46 | -23.33% |
| Average Price | 315,975 | 326,629 | 5.60% |
| Median Price | 295,000 | 300,000 | 4.71% |
Calgary Condominium Statistics
| Condominium / apartment | Sep-21 | YTD* | Y/Y% † |
|---|---|---|---|
| Sales | 366 | 3,145 | 78.29% |
| New Listings | 632 | 6,218 | 32.35% |
| Sales to New Listings Ratio | 57.91% | 50.58% | 13.03% |
| Inventory | 1,719 | 1,731 | 14.64% |
| Average Days on Market | 65 | 59 | -10.61% |
| Average Price | 257,687 | 262,806 | 2.54% |
| Median Price | 225,000 | 230,000 | 0.88% |
†Year-To-Date, year over year percent change.
‡Calgary Census Metropolitan Area includes Calgary, Airdrie, and Rocky View
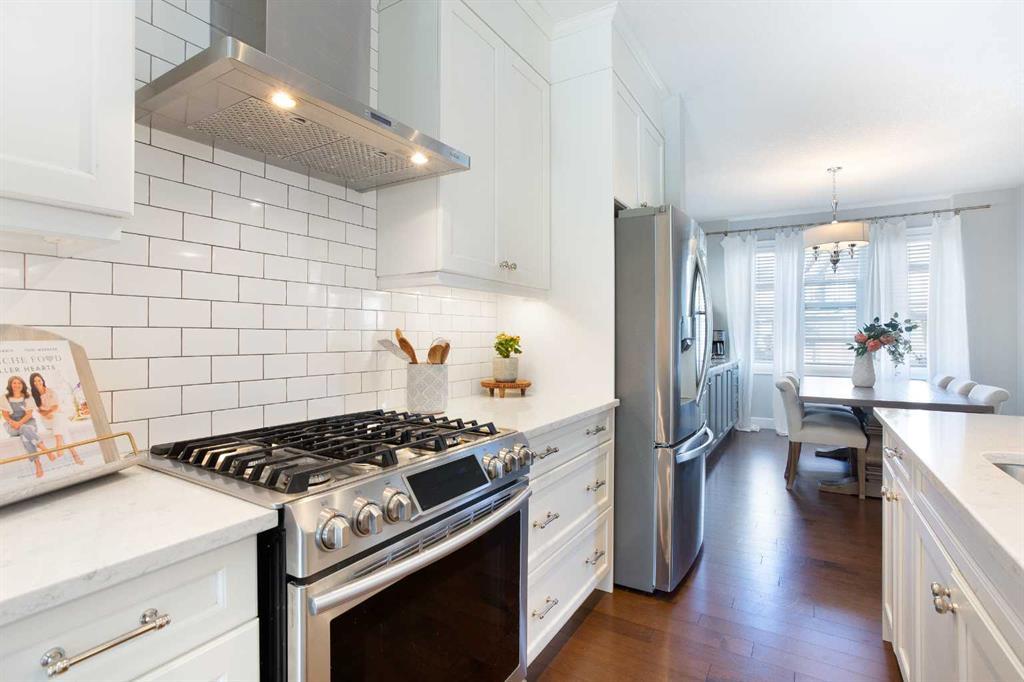
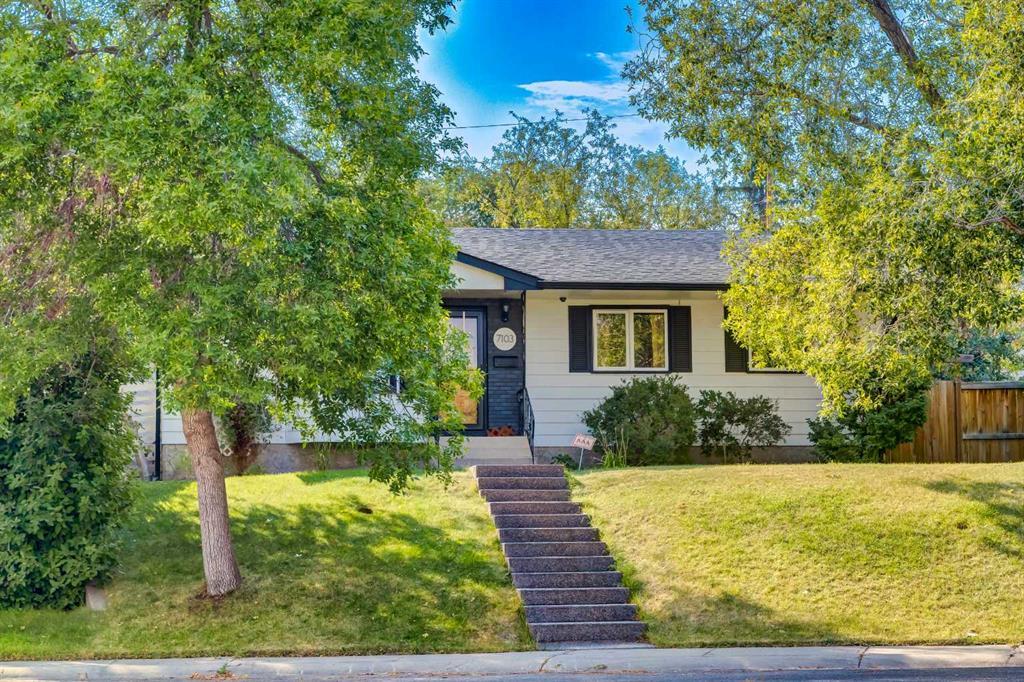
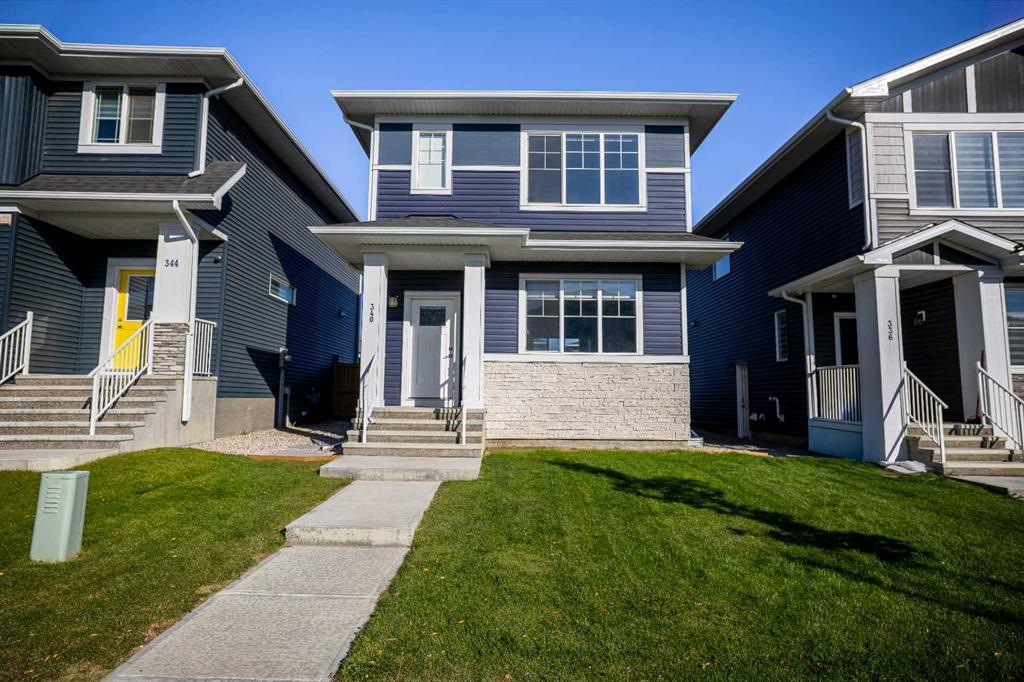
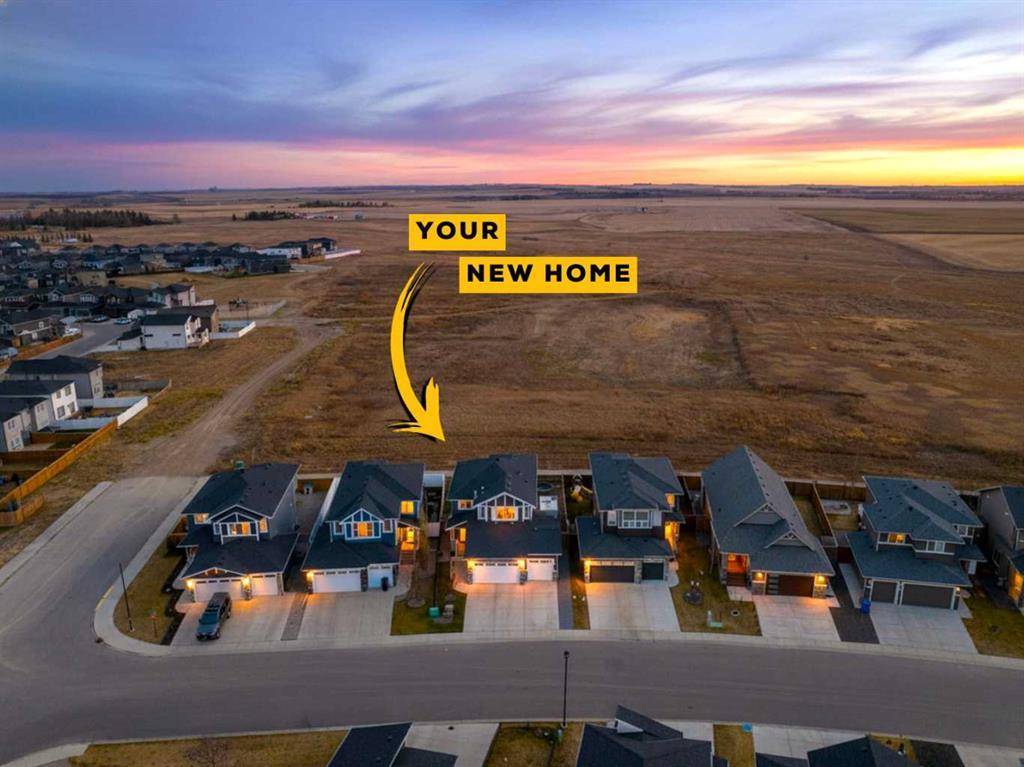
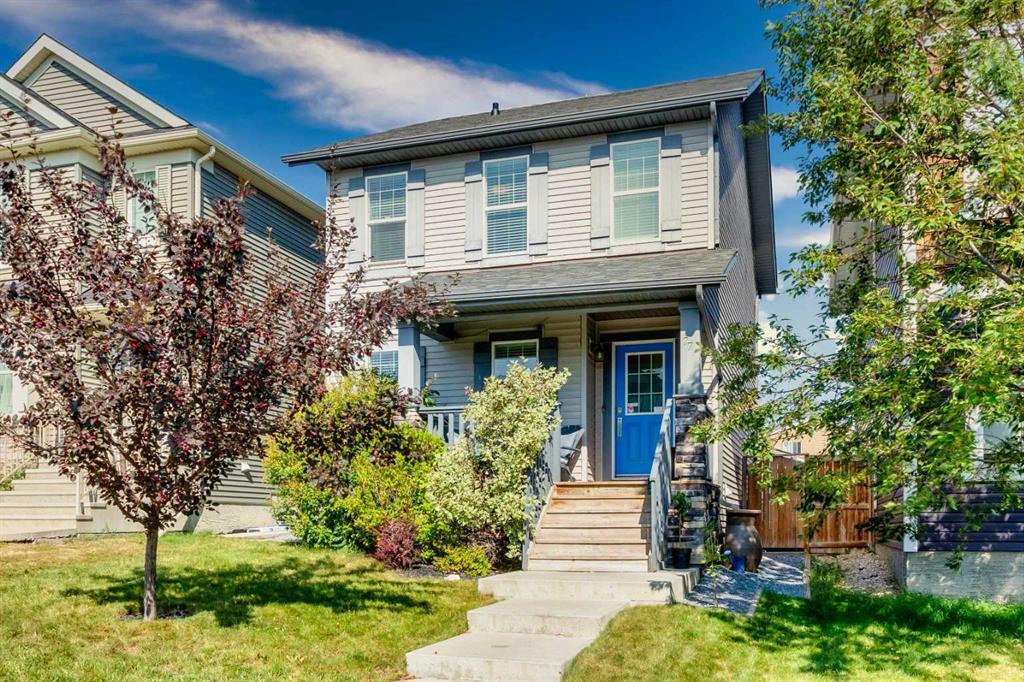
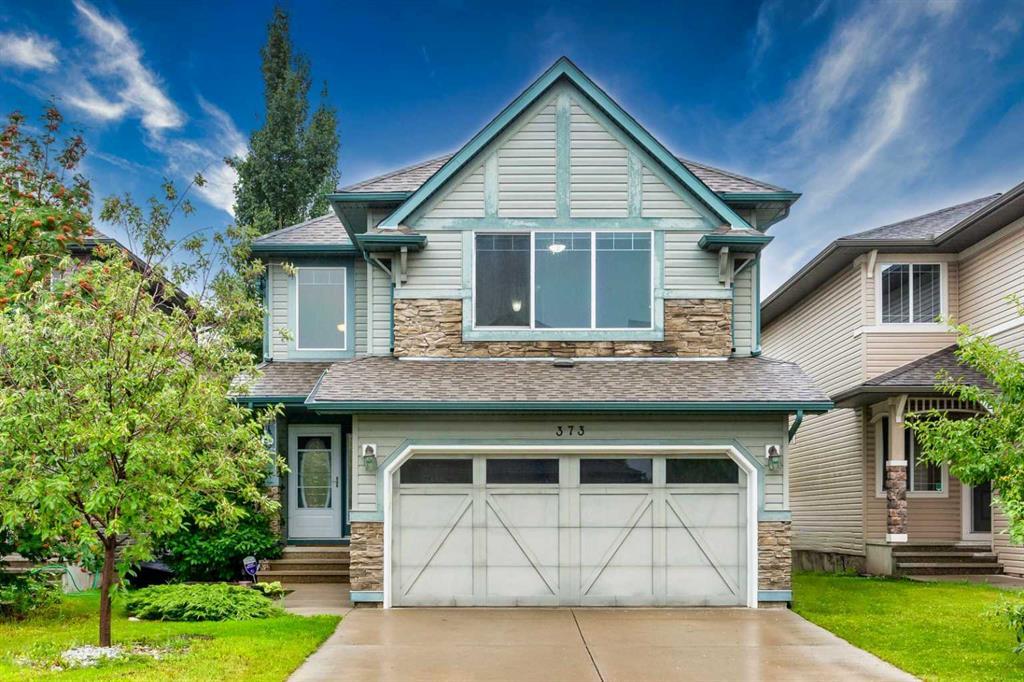
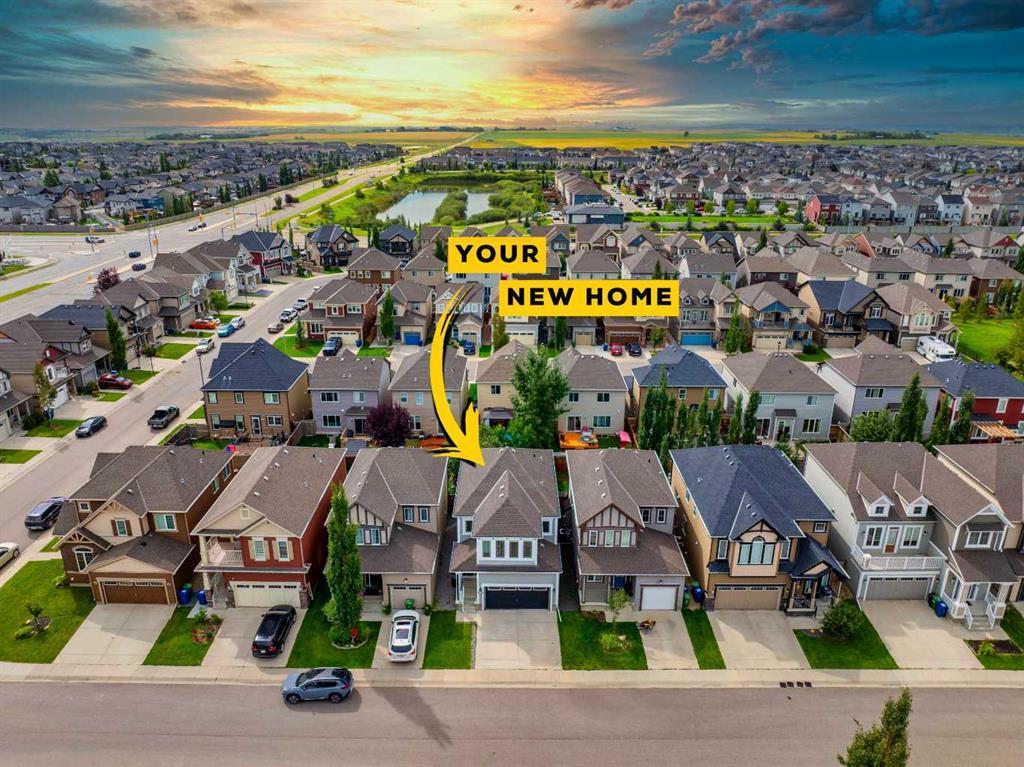
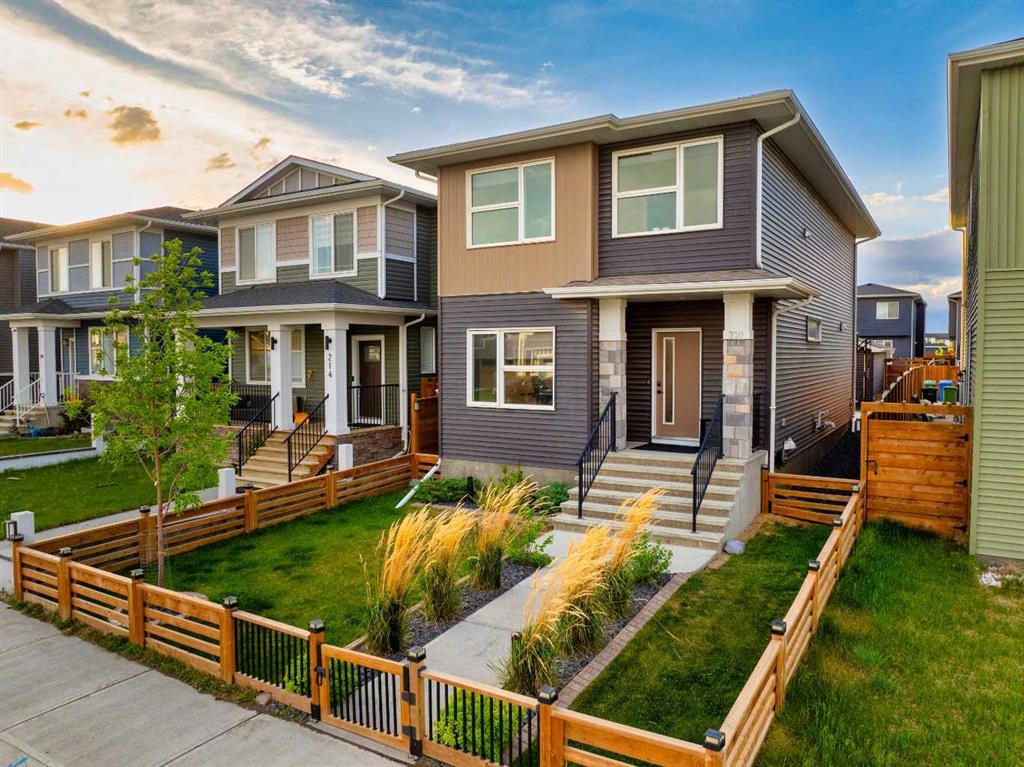
Our Featured Listings
Free Calgary Real Estate Monthly Market Report
If you're looking for the latest sales and statistics for your community in Calgary or one that you're interested in moving to, please fill out the form below and let us know which community you need a monthly market report set up for.








Leave A Comment