
August 2025 Calgary Real Estate Statistics Recap 
Sign Up For Our Monthly Real Estate Newsletter
Stay updated with the latest market reports, stats, and local events.
Latest Combined Calgary Real Estate Statistics: August 2025
Latest Combined Calgary Real Estate Statistics: August 2025
- Benchmark Price $577,200
- Inventory 6,661
- Sales to New Listings Ratio 57%
- Months of Inventory/Supply 3.35 Months of supply (Up 63% Y/Y)
Year to Date Calgary Real Estate Statistics: August 2025
- Benchmark Price $586,313
- Sales to New Listings Ratio 55%
- Months of Inventory/Supply 2.80 Months of supply (Up 115% Y/Y)
DOM = Number of Days on Market
As of September 8th 2025, the average number of days on market for all property types combined was 34 days (YTD) while the month of August saw an average DOM of 38
MLS® Listings in Calgary (New)
As of September 8th 2025, the total number of new active listings in the city of Calgary added to the market was 3,514 and in total there have been 31,302 YTD
Homes Sold in Calgary May 2025
The total number of homes sold for the month of August in Calgary was 2,023 this represents a 7.33% decrease Y/Y. The total sales for 2025 are 16,831.
Average Real Estate Prices in Calgary
In August 2025 the average price for a detached home in the city of Calgary was $780,928
Free Calgary Real Estate Monthly Market Report
If you're looking for the latest sales and statistics for your community in Calgary or one that you're interested in moving to, please fill out the form below and let us know which community you need a monthly market report set up for.
Average Real Estate Prices in Airdrie

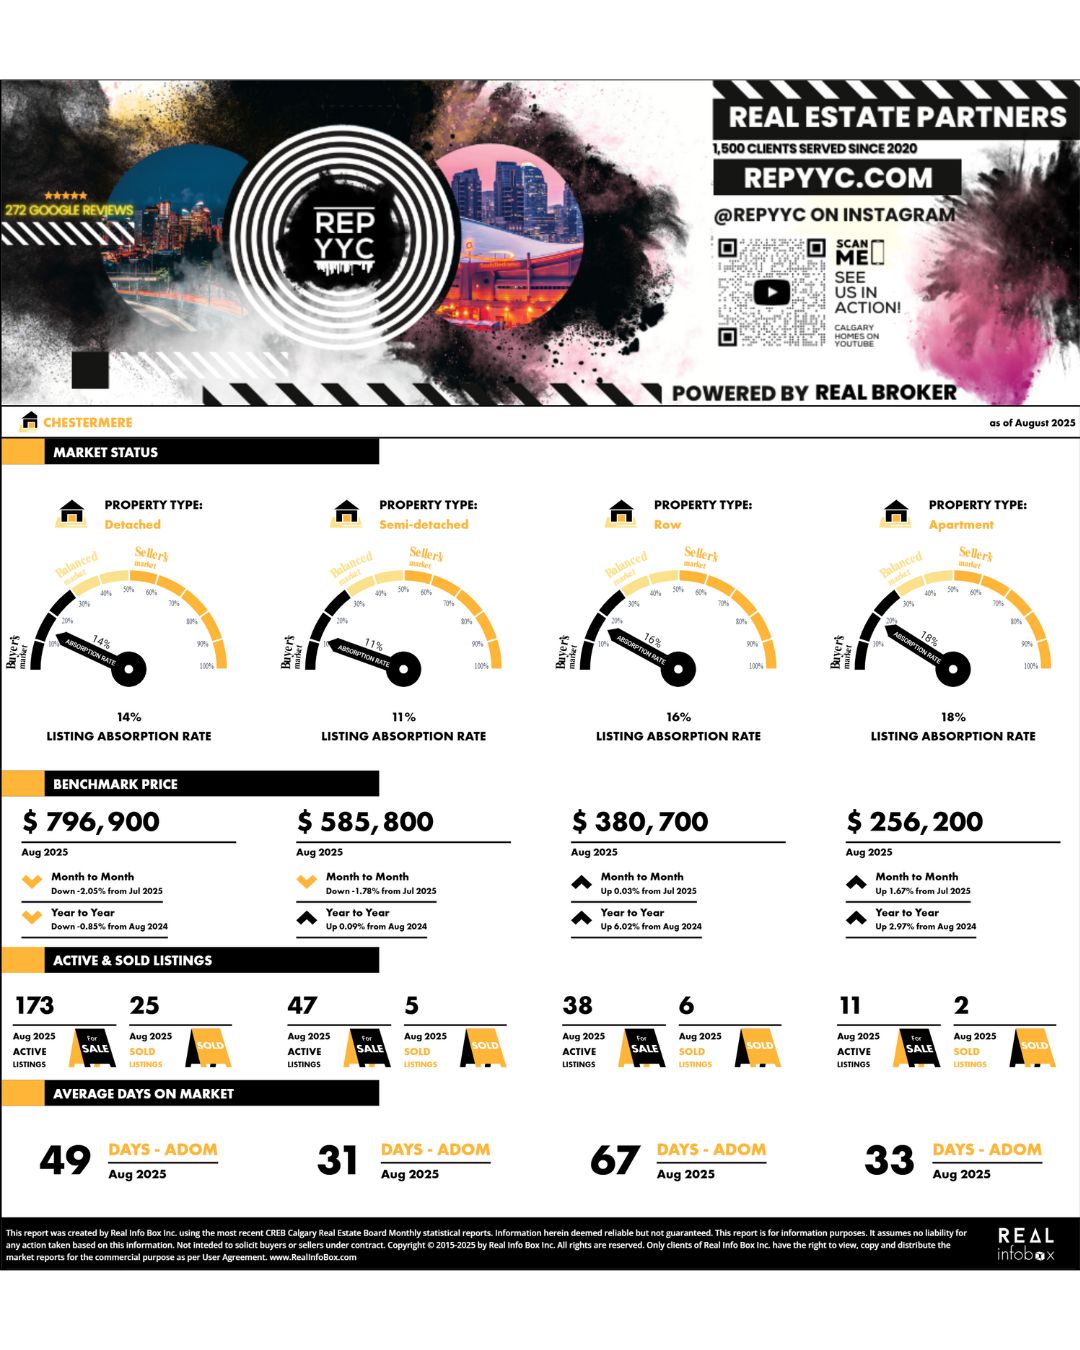
Average Real Estate Prices in Chestermere
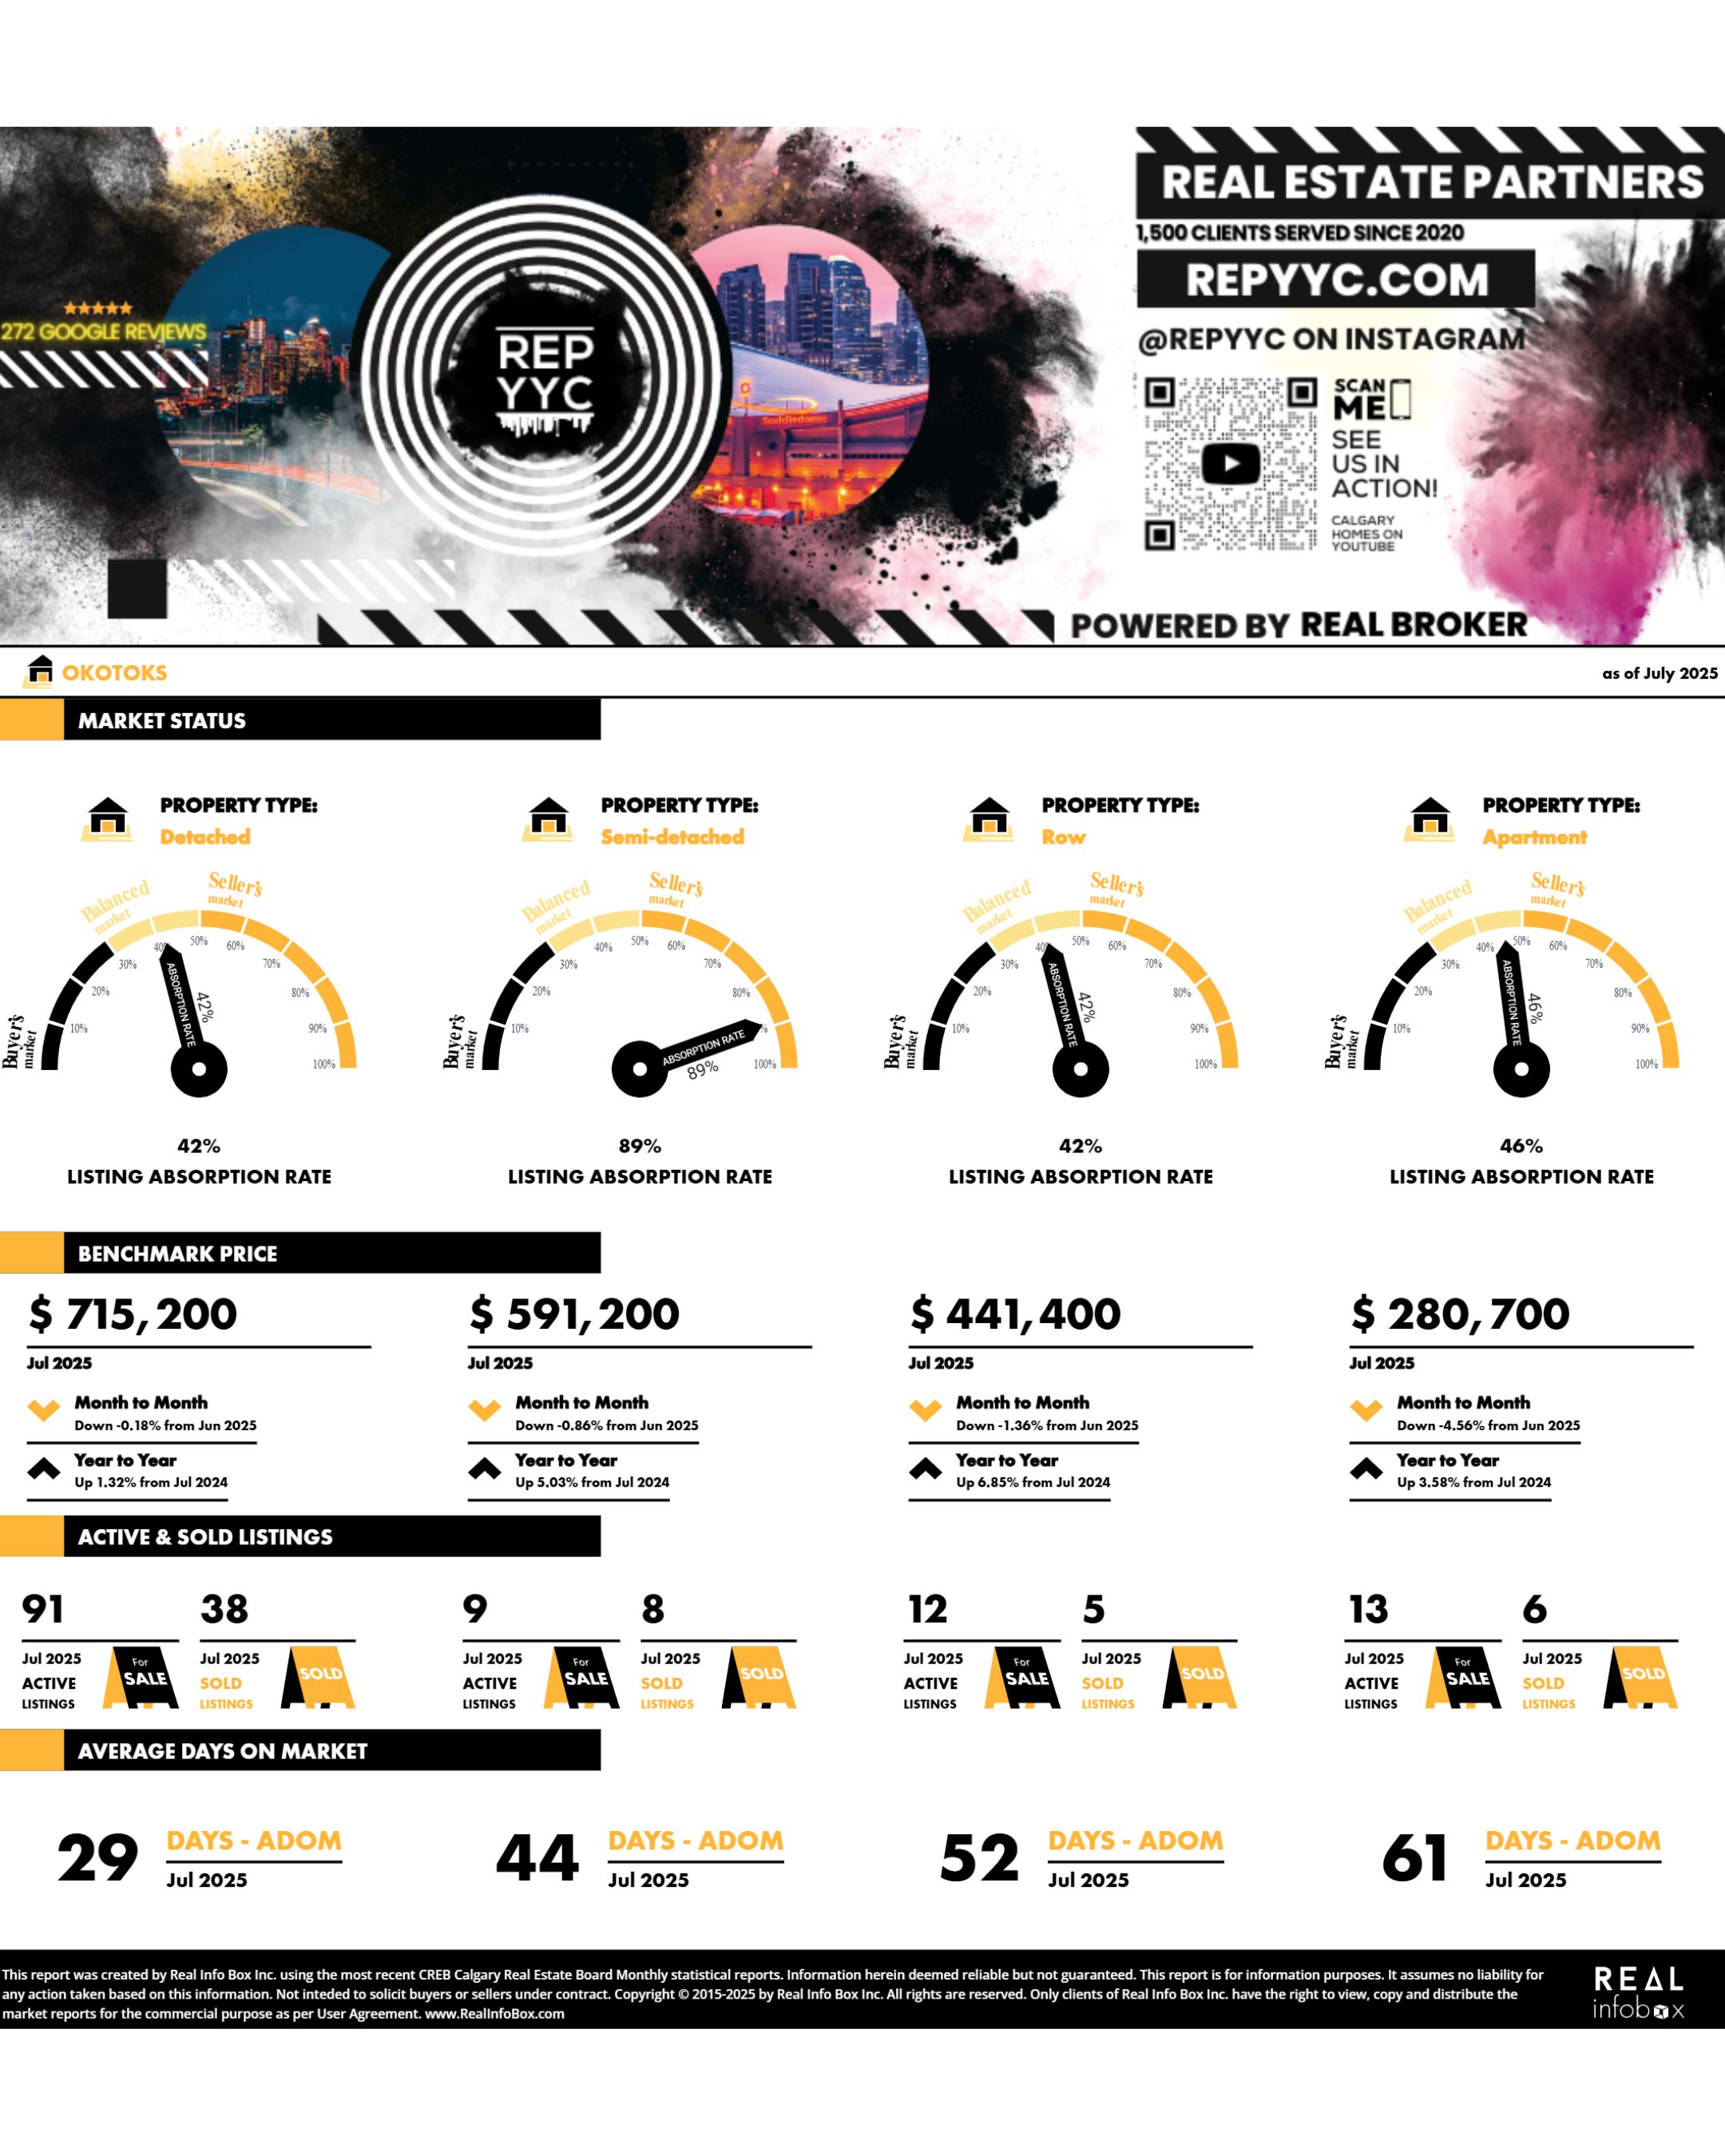
Average Real Estate Prices in Okotoks
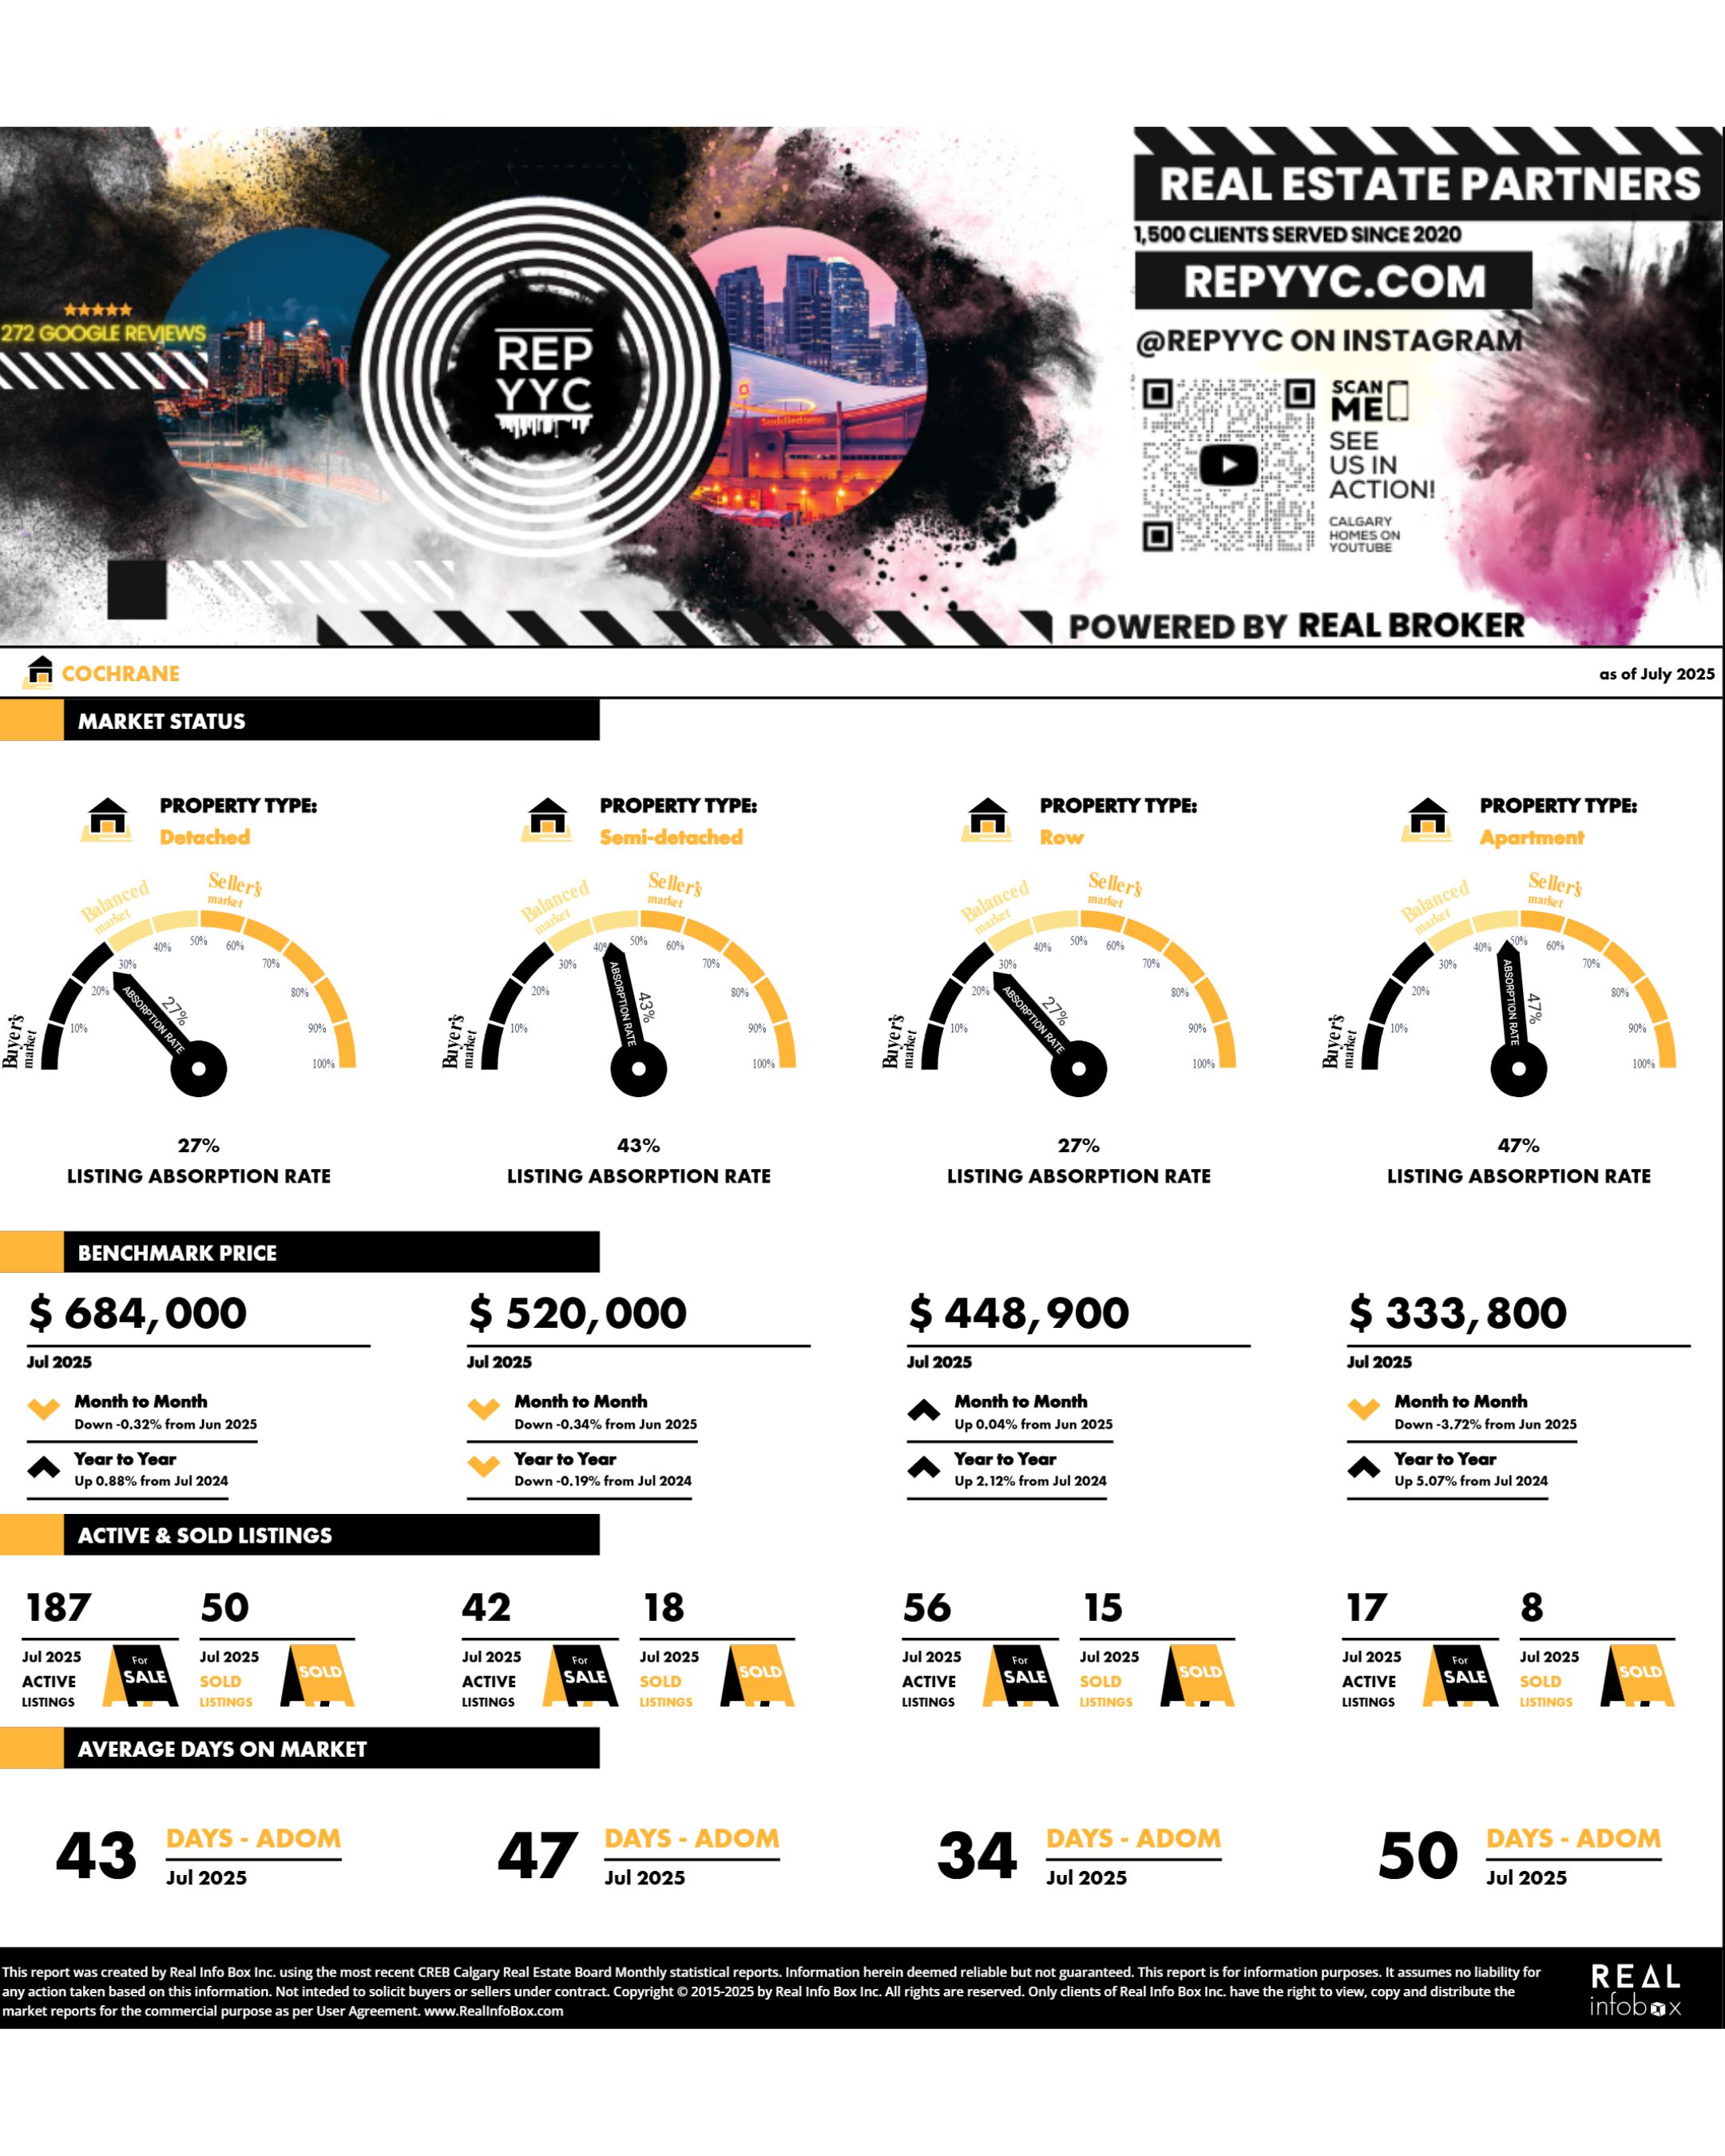
Average Real Estate Prices in Cochrane
Specific community spotlight real estate statistics
Huntington Hills August 2025 Homes Statistics
| Aug-25 | YTD* | Y/Y% † | |
|---|---|---|---|
| Sales | 12 | 107 | 12.63% |
| New Listings | 20 | 163 | 32.52% |
| Inventory | 37 | 27 | 145.45% |
| Sales To New Listings Ratio | 60.00% | 65.64% | -15.02% |
| Benchmark Price | 537,100 | 543,025 | -0.07% |
| Median Price | 480,000 | 538,000 | -4.95% |
| Average Price | 477,500 | 516,533 | -3.27% |
| Average Days on Market | 44 | 30 | 114.29% |
West Hillhurst August 2025 Homes Statistics
| Aug-25 | YTD* | Y/Y% † | |
|---|---|---|---|
| Sales | 40 | 131 | 12.93% |
| New Listings | 56 | 207 | 18.97% |
| Inventory | 44 | 36 | 24.14% |
| Sales To New Listings Ratio | 71.43% | 63.29% | -5.07% |
| Benchmark Price | 880,300 | 908,712 | 3.60% |
| Median Price | 413,490 | 747,750 | -15.79% |
| Average Price | 468,038 | 853,204 | -9.95% |
| Average Days on Market | 4 | 24 | -22.58% |
Ogden August 2025 Homes Statistics
| Aug-25 | YTD* | Y/Y% † | |
|---|---|---|---|
| Sales | 12 | 79 | -8.14% |
| New Listings | 17 | 109 | 0.93% |
| Inventory | 21 | 16 | 60.00% |
| Sales To New Listings Ratio | 70.59% | 72.48% | -8.98% |
| Benchmark Price | 489,300 | 501,687 | 2.90% |
| Median Price | 484,500 | 489,000 | -3.17% |
| Average Price | 466,400 | 497,509 | -1.77% |
| Average Days on Market | 32 | 26 | 62.50% |
West Springs August 2025 Homes Statistics
| Aug-25 | YTD* | Y/Y% † | |
|---|---|---|---|
| Sales | 15 | 155 | -4.32% |
| New Listings | 34 | 331 | 46.46% |
| Inventory | 64 | 63 | 162.50% |
| Sales To New Listings Ratio | 44.12% | 46.83% | -34.67% |
| Benchmark Price | 773,500 | 803,800 | -1.18% |
| Median Price | 749,000 | 782,500 | 2.62% |
| Average Price | 867,600 | 888,358 | 7.43% |
| Average Days on Market | 21 | 29 | 61.11% |
2025 Greater Calgary Regional Market Statistics
City Centre Calgary August 2025 Statistics
| Aug-25 | YTD* | Y/Y% † | |
|---|---|---|---|
| Sales | 393 | 3,340 | -25.38% |
| New Listings | 703 | 6,313 | -4.72% |
| Inventory | 1,471 | 1,360 | 31.91% |
| Sales To New Listings Ratio | 55.90% | 52.91% | -21.67% |
| Benchmark Price | 581,000 | 590,662 | -2.38% |
| Median Price | 468,000 | 498,250 | 13.24% |
| Average Price | 625,176 | 676,609 | 10.76% |
| Average Days on Market | 38 | 36 | 33.33% |
North Calgary August 2025 Statistics
| Aug-25 | YTD* | Y/Y% † | |
|---|---|---|---|
| Sales | 235 | 2,032 | -7.43% |
| New Listings | 451 | 3,794 | 24.60% |
| Inventory | 889 | 718 | 117.58% |
| Sales To New Listings Ratio | 52.11% | 53.56% | -25.70% |
| Benchmark Price | 540,300 | 550,087 | -3.27% |
| Median Price | 550,000 | 565,000 | -2.40% |
| Average Price | 561,639 | 561,514 | -1.93% |
| Average Days on Market | 41 | 35 | 75.00% |
Northeast Calgary August 2025 Statistics
| Aug-25 | YTD* | Y/Y% † | |
|---|---|---|---|
| Sales | 218 | 1,680 | -29.02% |
| New Listings | 536 | 4,060 | 19.31% |
| Inventory | 1,047 | 894 | 113.37% |
| Sales To New Listings Ratio | 40.67% | 41.38% | -40.51% |
| Benchmark Price | 490,600 | 503,200 | -3.28% |
| Median Price | 533,000 | 518,875 | -1.35% |
| Average Price | 502,840 | 508,887 | -1.01% |
| Average Days on Market | 42 | 40 | 66.67% |
East Calgary August 2025 Statistics
| Aug-25 | YTD* | Y/Y% † | |
|---|---|---|---|
| Sales | 58 | 514 | -24.30% |
| New Listings | 122 | 976 | 11.93% |
| Inventory | 239 | 182 | 104.49% |
| Sales To New Listings Ratio | 47.54% | 52.66% | -32.37% |
| Benchmark Price | 410,200 | 424,950 | -2.41% |
| Median Price | 473,000 | 450,000 | -0.46% |
| Average Price | 447,852 | 432,937 | -0.75% |
| Average Days on Market | 32 | 31 | 55.00% |
Southeast Calgary August 2025 Statistics
| Aug-25 | YTD* | Y/Y% † | |
|---|---|---|---|
| Sales | 340 | 2,417 | -2.11% |
| New Listings | 449 | 4,253 | 35.14% |
| Inventory | 886 | 790 | 140.12% |
| Sales To New Listings Ratio | 75.72% | 56.83% | -27.57% |
| Benchmark Price | 568,000 | 578,275 | -1.08% |
| Median Price | 556,500 | 582,500 | 2.19% |
| Average Price | 572,324 | 599,013 | 1.68% |
| Average Days on Market | 39 | 34 | 70.00% |
South Calgary August 2025 Statistics
| Aug-25 | YTD* | Y/Y% † | |
|---|---|---|---|
| Sales | 354 | 3,042 | -11.29% |
| New Listings | 563 | 4,962 | 14.25% |
| Inventory | 975 | 829 | 87.56% |
| Sales To New Listings Ratio | 62.88% | 61.31% | -22.34% |
| Benchmark Price | 577,500 | 583,900 | 0.03% |
| Median Price | 580,500 | 612,000 | 2.17% |
| Average Price | 598,878 | 621,498 | 3.44% |
| Average Days on Market | 35 | 30 | 50.00% |
West Calgary August 2025 Statistics
| Aug-25 | YTD* | Y/Y% † | |
|---|---|---|---|
| Sales | 202 | 1,616 | -15.83% |
| New Listings | 317 | 2,814 | 12.11% |
| Inventory | 555 | 503 | 80.94% |
| Sales To New Listings Ratio | 63.72% | 57.43% | -24.92% |
| Benchmark Price | 707,000 | 715,750 | -0.02% |
| Median Price | 755,000 | 748,000 | 6.55% |
| Average Price | 822,240 | 805,149 | 6.94% |
| Average Days on Market | 32 | 28 | 40.00% |
Northwest Calgary August 2025 Statistics
| Aug-25 | YTD* | Y/Y% † | |
|---|---|---|---|
| Sales | 218 | 1,849 | -12.49% |
| New Listings | 367 | 3,048 | 10.31% |
| Inventory | 616 | 499 | 72.07% |
| Sales To New Listings Ratio | 59.40% | 60.66% | -20.67% |
| Benchmark Price | 635,300 | 644,150 | -0.82% |
| Median Price | 634,350 | 680,000 | 3.82% |
| Average Price | 657,165 | 689,986 | 5.99% |
| Average Days on Market | 34 | 29 | 52.63% |
Airdrie Real Estate August 2025 Statistics
| Aug-25 | YTD* | Y/Y% † | |
|---|---|---|---|
| Sales | 151 | 1,247 | -12.24% |
| New Listings | 265 | 2,246 | 22.67% |
| Inventory | 537 | 443 | 110.95% |
| Sales To New Listings Ratio | 56.98% | 55.52% | -28.46% |
| Benchmark Price | 531,100 | 538,412 | -0.85% |
| Median Price | 533,250 | 546,500 | -0.64% |
| Average Price | 521,085 | 558,518 | 2.74% |
| Average Days on Market | 43 | 38 | 72.73% |
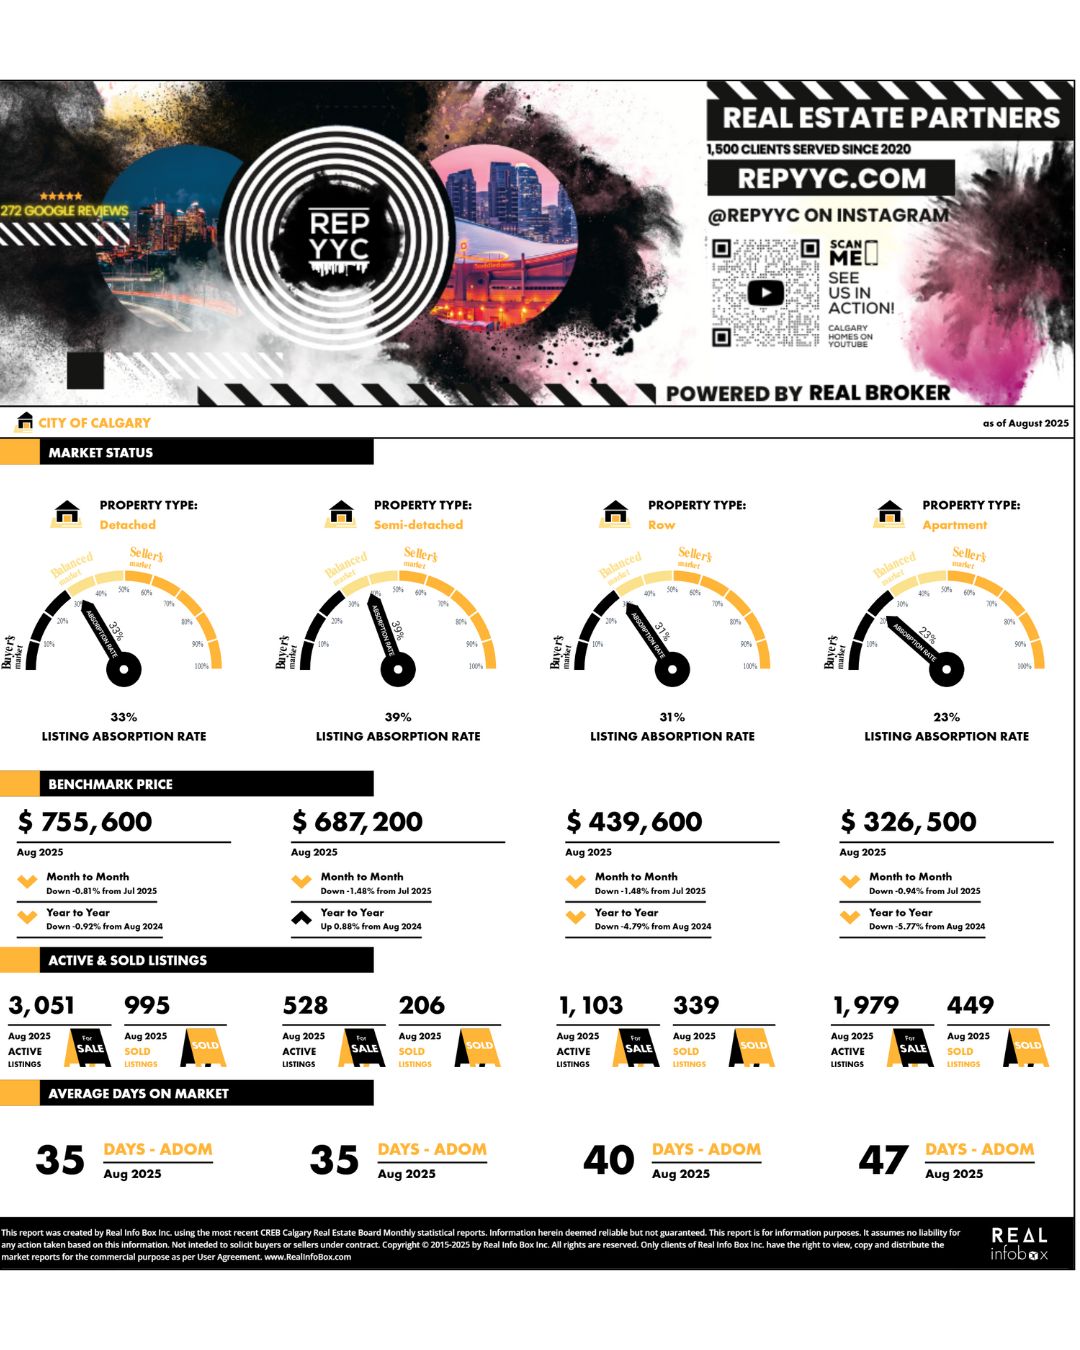
Calgary Detached Homes August 2025 Statistics
| Aug-25 | YTD* | Y/Y% † | |
|---|---|---|---|
| Sales | 995 | 8,061 | -9.70% |
| New Listings | 1,748 | 14,495 | 17.60% |
| Inventory | 3,069 | 2,532 | 70.97% |
| Sales To New Listings Ratio | 56.92% | 55.61% | -23.21% |
| Benchmark Price | 755,600 | 762,687 | 2.11% |
| Median Price | 689,000 | 716,275 | 0.18% |
| Average Price | 780,928 | 817,575 | 1.85% |
| Average Days on Market | 34 | 30 | 36.36% |
Calgary Semi-Detached Homes August 2025 Statistics
| Aug-25 | YTD* | Y/Y% † | |
|---|---|---|---|
| Sales | 206 | 1,557 | -7.82% |
| New Listings | 311 | 2,621 | 17.69% |
| Inventory | 535 | 466 | 79.92% |
| Sales To New Listings Ratio | 66.24% | 59.40% | -21.68% |
| Benchmark Price | 687,200 | 689,912 | 3.74% |
| Median Price | 586,750 | 610,000 | 0.00% |
| Average Price | 657,177 | 690,762 | 1.27% |
| Average Days on Market | 35 | 31 | 40.91% |
Calgary Row Home August 2025 Statistics
| Aug-25 | YTD* | Y/Y% † | |
|---|---|---|---|
| Sales | 339 | 2,835 | -15.63% |
| New Listings | 544 | 5,027 | 16.28% |
| Inventory | 1,108 | 962 | 125.82% |
| Sales To New Listings Ratio | 62.32% | 56.40% | -27.43% |
| Benchmark Price | 439,600 | 449,100 | -0.52% |
| Median Price | 435,000 | 450,000 | -1.75% |
| Average Price | 459,523 | 468,887 | -0.23% |
| Average Days on Market | 39 | 33 | 65.00% |
Calgary Condominium August 2025 Statistics
| Aug-25 | YTD* | Y/Y% † | |
|---|---|---|---|
| Sales | 483 | 4,067 | -28.91% |
| New Listings | 911 | 8,135 | 2.77% |
| Inventory | 1,984 | 1,834 | 73.02% |
| Sales To New Listings Ratio | 53.02% | 49.99% | -30.83% |
| Benchmark Price | 326,500 | 332,825 | -0.55% |
| Median Price | 315,000 | 320,000 | -1.23% |
| Average Price | 338,868 | 350,103 | 0.83% |
| Average Days on Market | 43 | 41 | 64.00% |
*Year-To-Date as of September 8th, 2025
†Year-To-Date, year over year percent change. ‡Calgary Census Metropolitan Area includes Calgary, Airdrie, and Rocky View
Leave A Comment