.jpg)
November 2024 Calgary Real Estate Statistics Recap

Sign Up For Our Monthly Real Estate Newsletter
Stay updated with the latest market reports, stats, and local events.
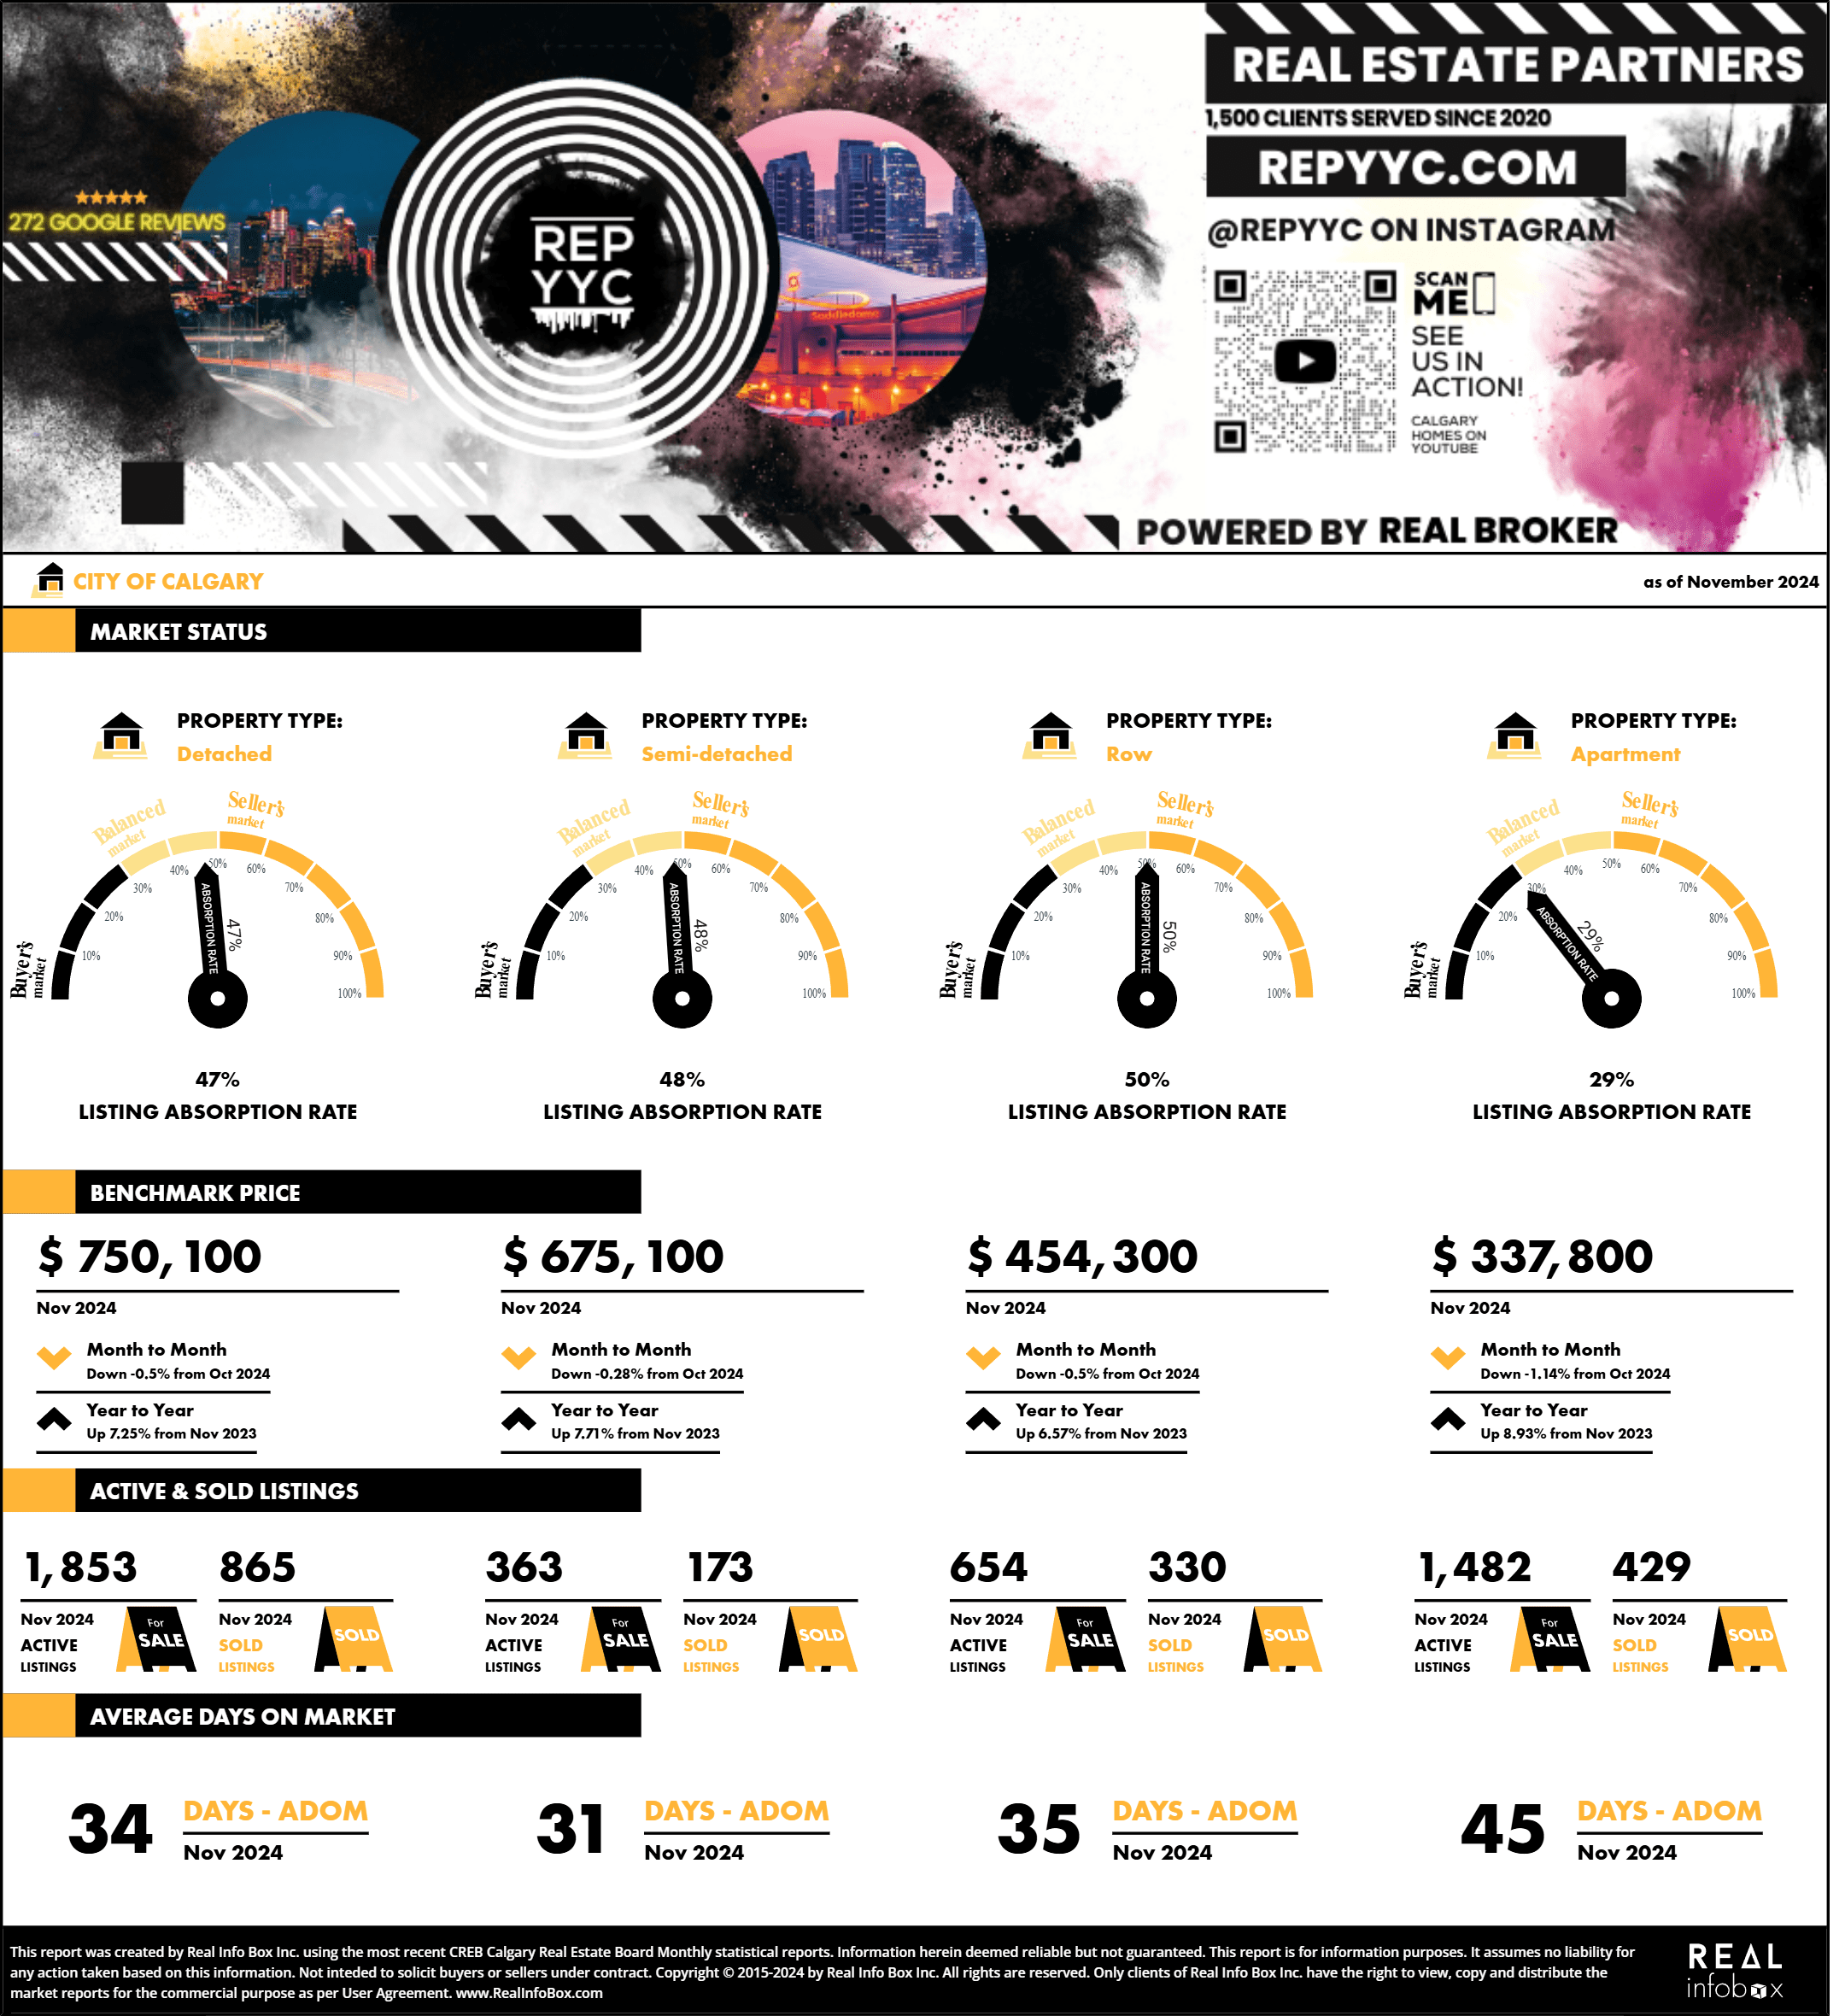
Latest Combined Calgary Real Estate Statistics: November 2024
-
Year to Date Calgary Real Estate Statistics: November 2024
Latest Combined Calgary Real Estate Statistics: November
- Benchmark Price $587,900
- Inventory 4,352
- Sales to New Listings Ratio 77%
- Months of Inventory/Supply 2.42 Months of supply (Up 44% Y/Y)
Year to Date Calgary Real Estate Statistics: November 2024
- Benchmark Price $594,545
- Sales to New Listings Ratio 71%
- Months of Inventory/Supply 1.56 Months of supply (Up 17% Y/Y)
DOM = Number of Days on Market
As of December 3rd 2024, the average number of days on market for all property types combined was 24 days (YTD) while the month of November saw an average DOM of 36
MLS® Listings in Calgary (New)
As of December 3rd 2024, the total number of new active listings in the city of Calgary added to the market was 2,329 and in total there have been 36,076 YTD
Homes Sold in Calgary November 2024
The total number of homes sold for the month of November in Calgary was 1,797 this represents a 1.45% decrease Y/Y. The total sales for 2024 are 25,666.
Average Real Estate Prices in Calgary
In November 2024 the average price for a detached home in the city of Calgary was $785,414
Free Calgary Real Estate Monthly Market Report
If you're looking for the latest sales and statistics for your community in Calgary or one that you're interested in moving to, please fill out the form below and let us know which community you need a monthly market report set up for.
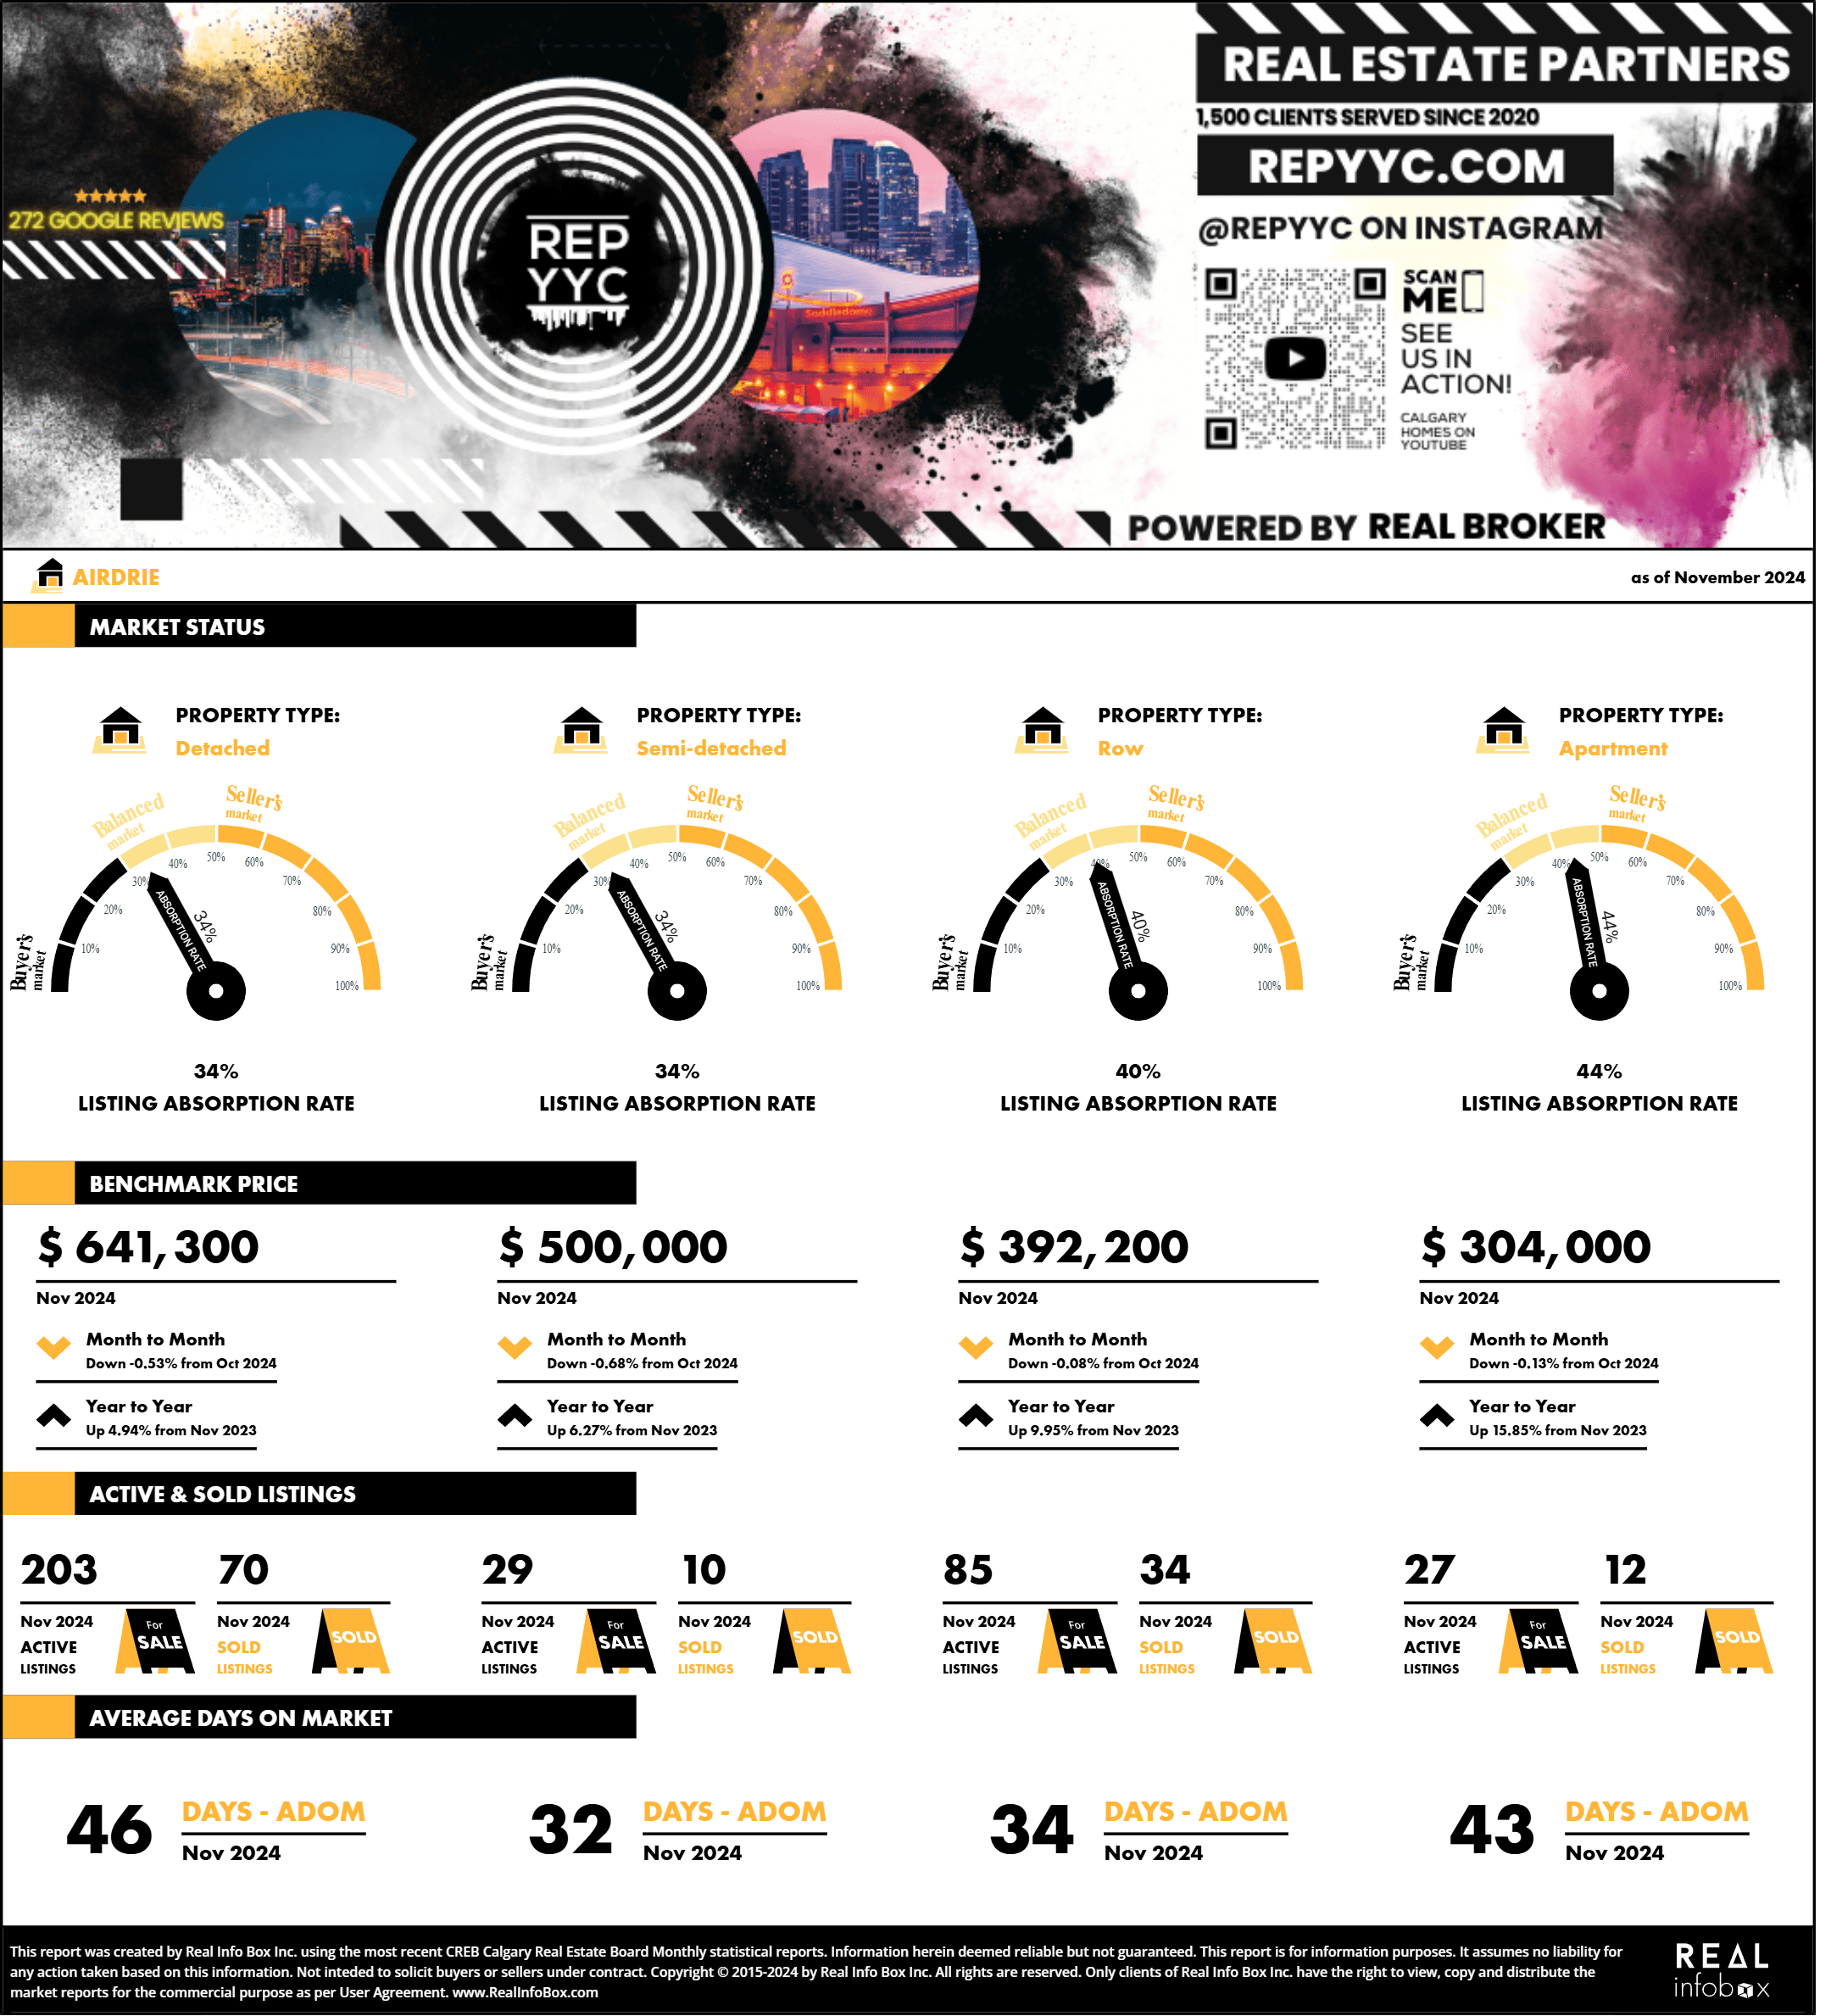
Average Real Estate Prices in Airdrie
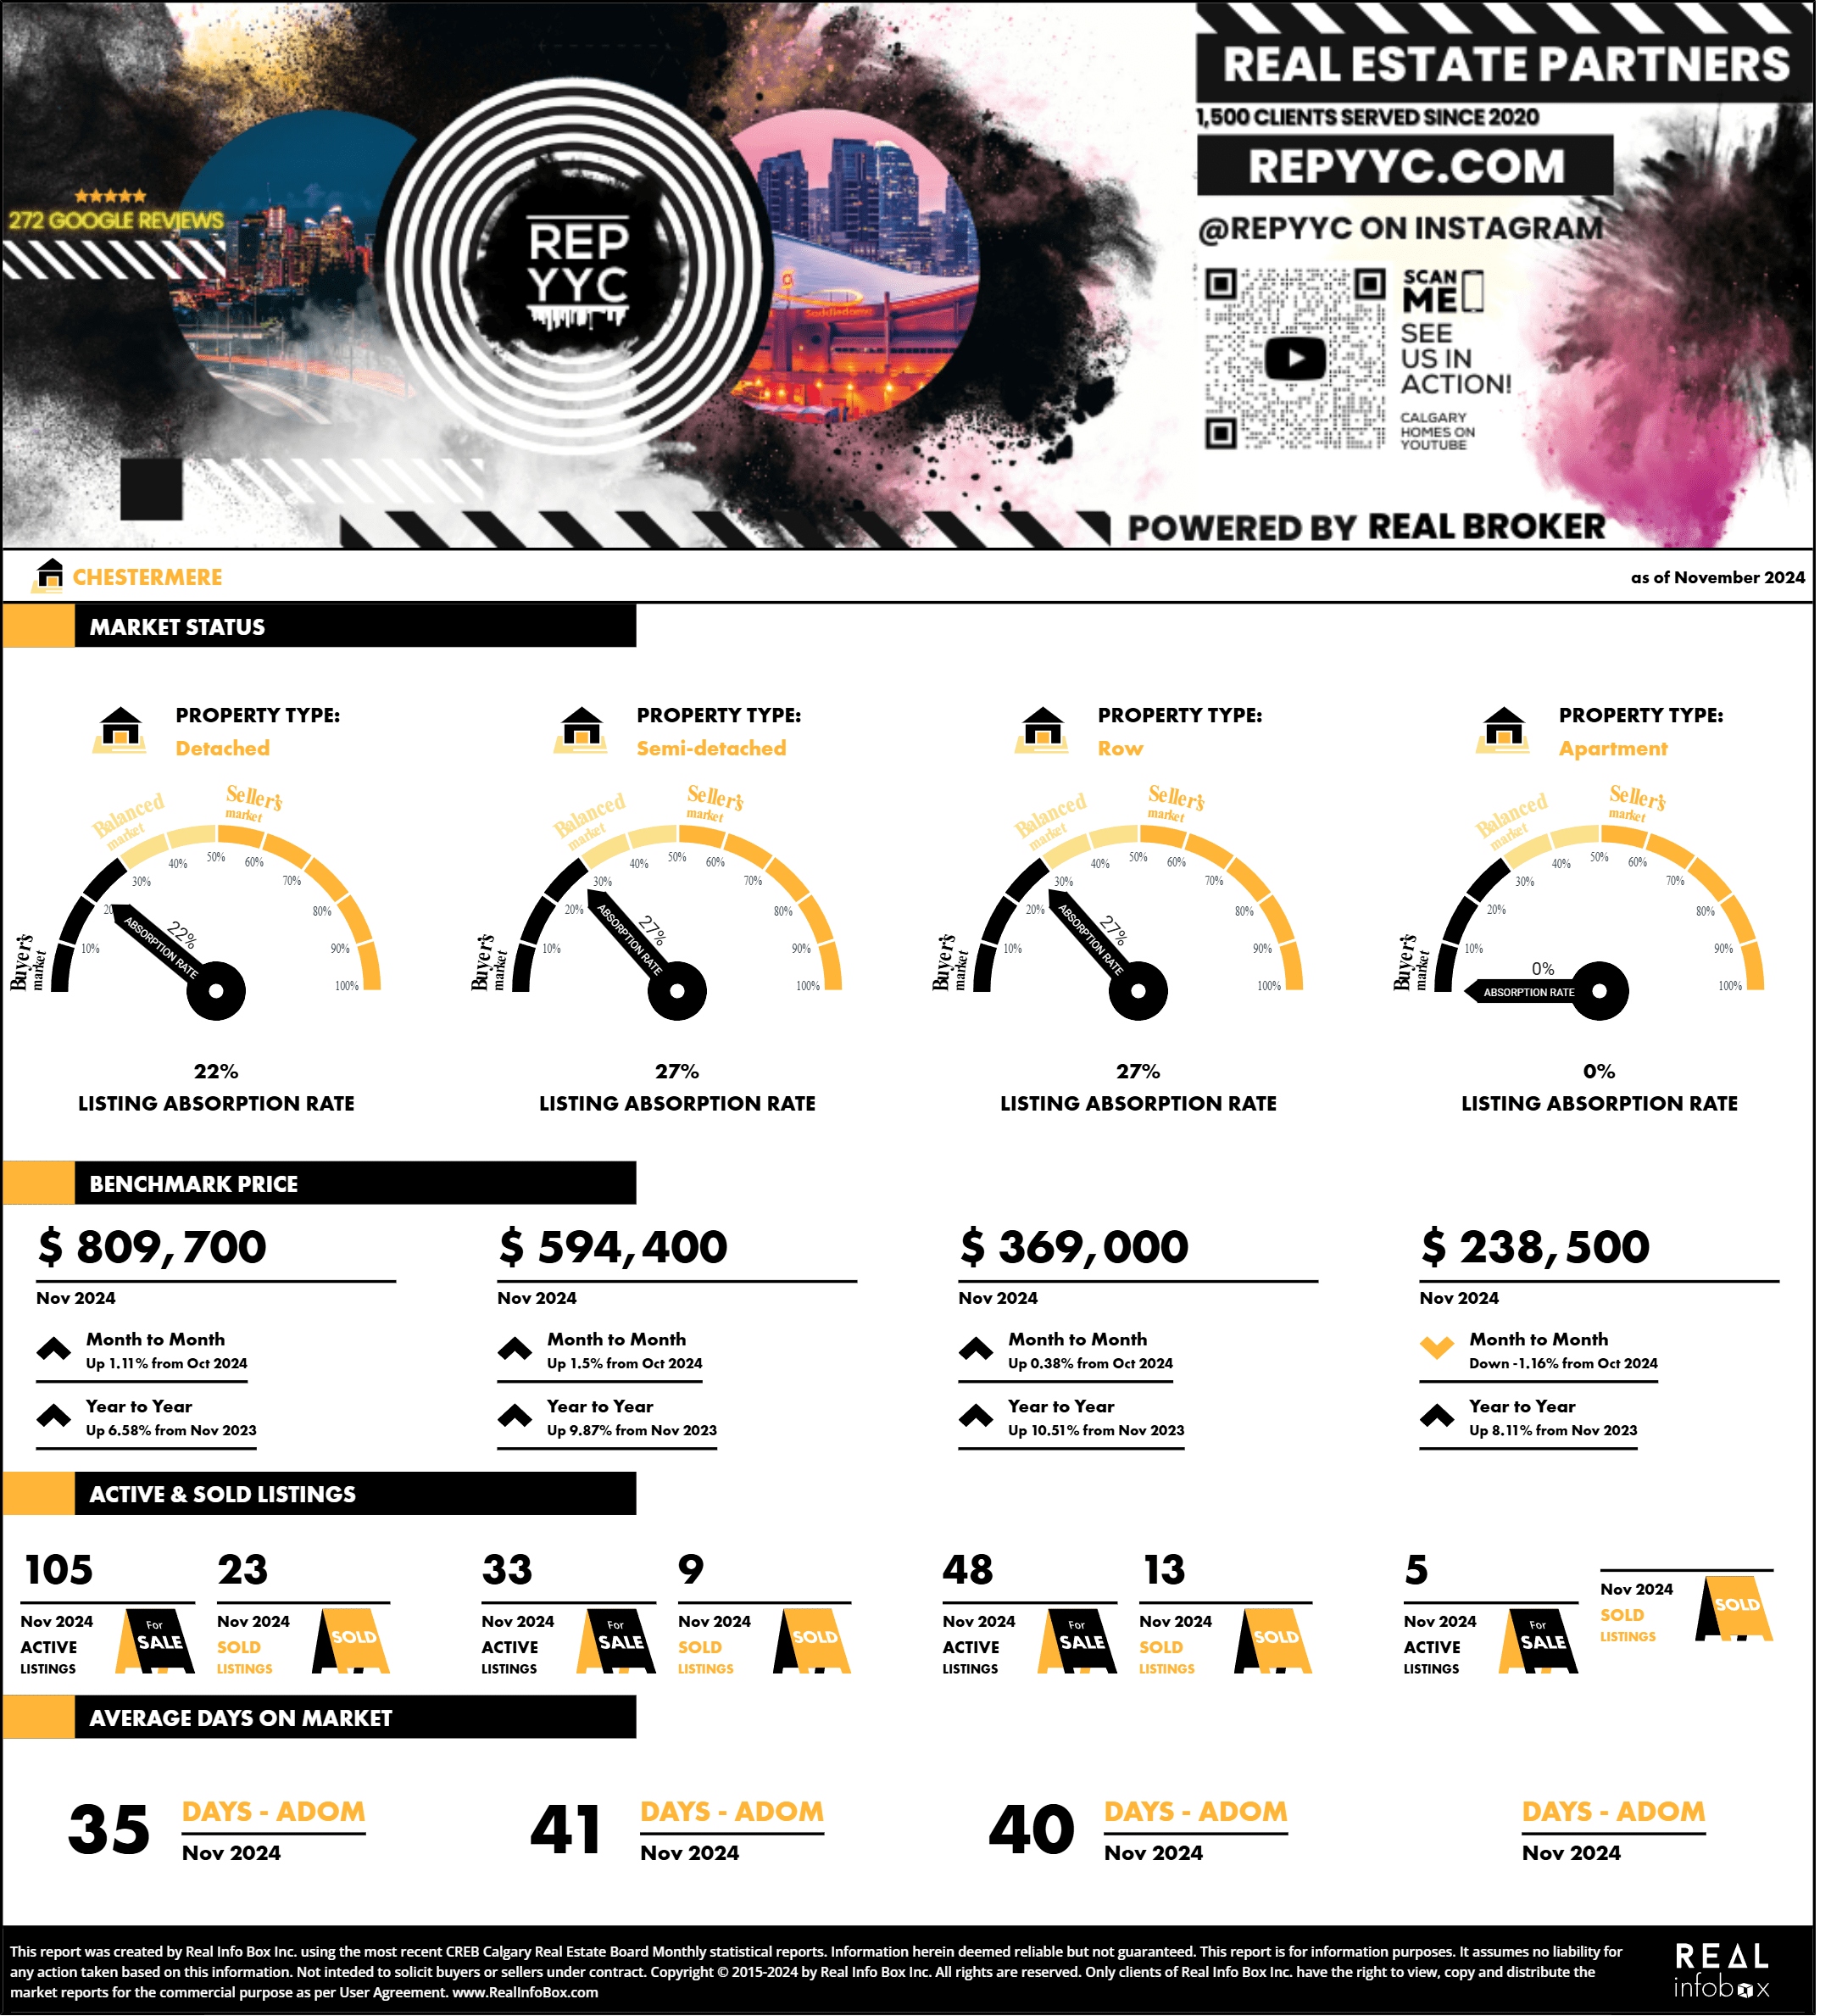
Average Real Estate Prices in Chestermere
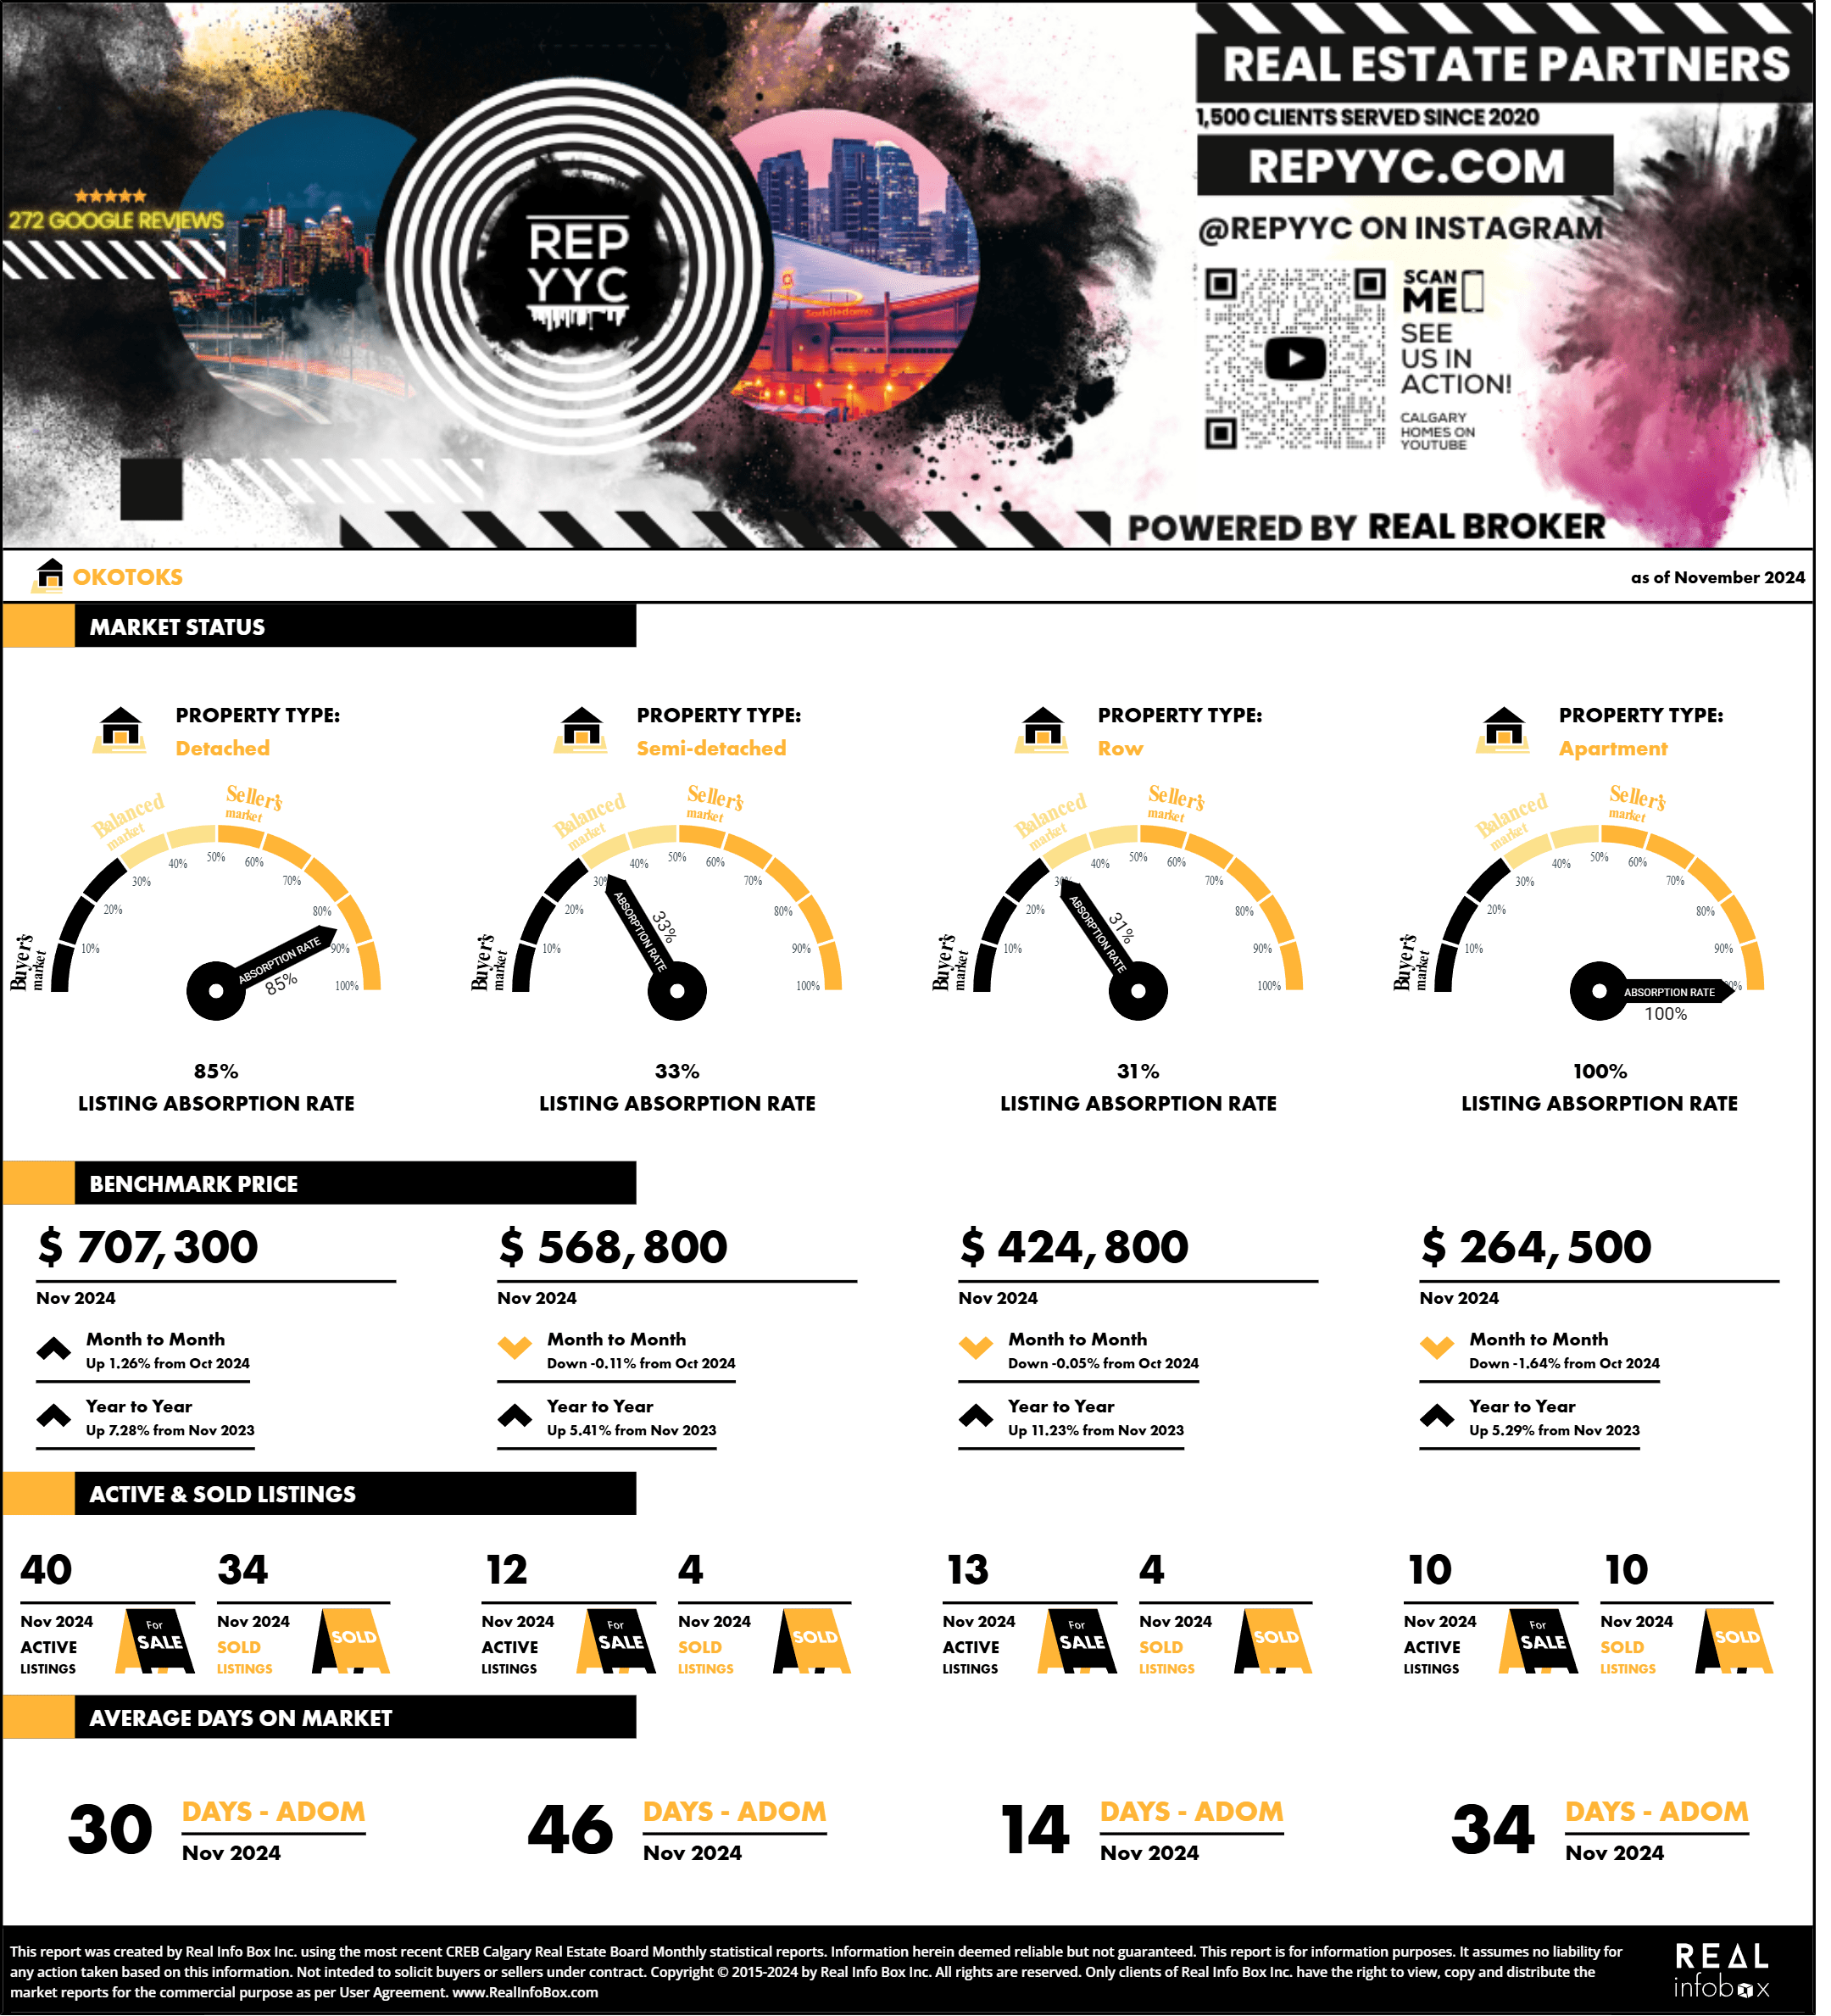
Average Real Estate Prices in Okotoks
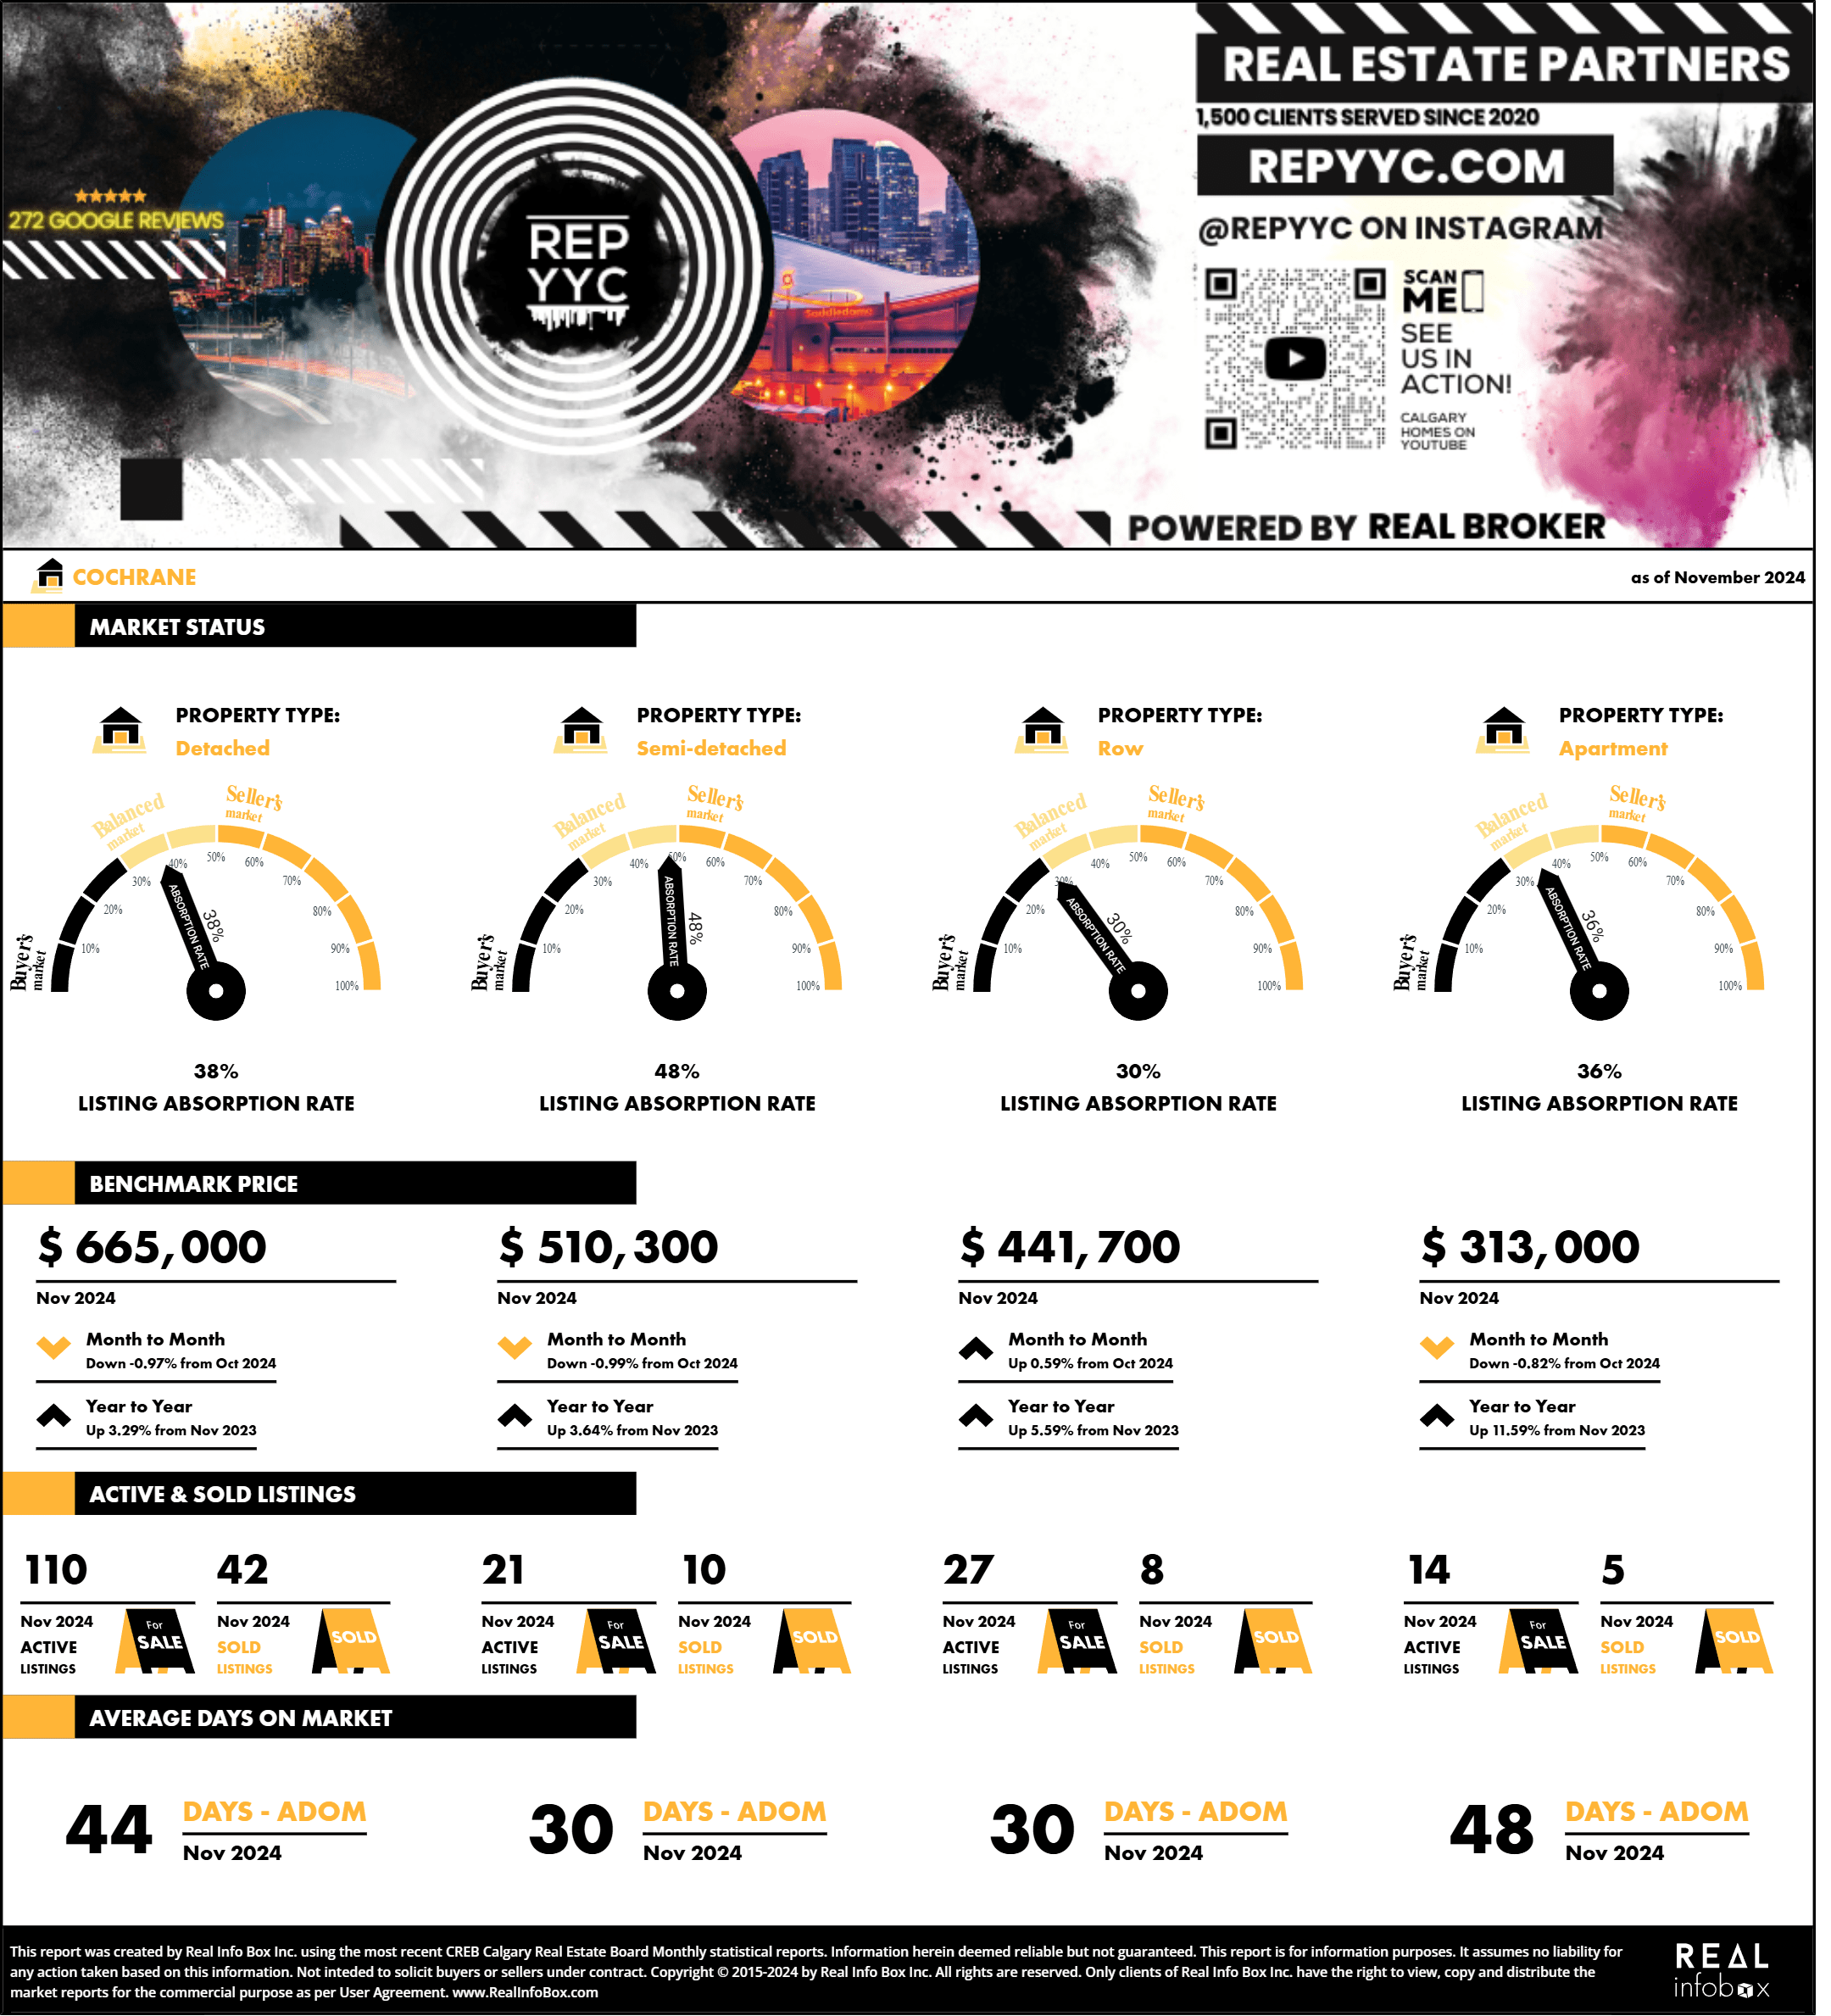
Average Real Estate Prices in Cochrane
Specific community spotlight real estate statistics
Hillhurst November 2024 Detached Homes Statistics
| Nov-24 | YTD* | Y/Y% † | |
|---|---|---|---|
| Sales | 4 | 37 | -17.78% |
| New Listings | 1 | 59 | -19.18% |
| Inventory | 7 | 9 | -10.00% |
| Sales To New Listings Ratio | 400.00% | 62.71% | 1.74% |
| Benchmark Price | 880,800 | 876,190 | 5.66% |
| Median Price | 874,000 | 927,500 | 1.37% |
| Average Price | 893,250 | 1,060,713 | -0.90% |
| Average Days on Market | 59 | 35 | -7.89% |
Abbeydale November 2024 Detached Homes Statistics
| Nov-24 | YTD* | Y/Y% † | |
|---|---|---|---|
| Sales | 4 | 62 | 12.73% |
| New Listings | 5 | 81 | 37.29% |
| Inventory | 6 | 6 | 50.00% |
| Sales To New Listings Ratio | 80.00% | 76.54% | -17.89% |
| Benchmark Price | 486,200 | 483,081 | 18.03% |
| Median Price | 511,500 | 523,000 | 21.63% |
| Average Price | 517,250 | 520,617 | 19.85% |
| Average Days on Market | 31 | 18 | -18.18% |
Harvest Hills November 2024 Detached Homes Statistics
| Nov-24 | YTD* | Y/Y% † | |
|---|---|---|---|
| Sales | 3 | 58 | -18.31% |
| New Listings | 7 | 79 | -9.20% |
| Inventory | 10 | 6 | 0.00% |
| Sales To New Listings Ratio | 42.86% | 73.42% | -10.04% |
| Benchmark Price | 627,500 | 625,027 | 11.06% |
| Median Price | 685,500 | 651,000 | 12.24% |
| Average Price | 686,417 | 670,865 | 12.90% |
| Average Days on Market | 32 | 17 | -15.00% |
Southwood November 2024 Detached Homes Statistics
| Nov-24 | YTD* | Y/Y% † | |
|---|---|---|---|
| Sales | 5 | 53 | 8.16% |
| New Listings | 2 | 68 | 28.30% |
| Inventory | 6 | 4 | 0.00% |
| Sales To New Listings Ratio | 250.00% | 77.94% | -15.69% |
| Benchmark Price | 654,300 | 658,763 | 12.20% |
| Median Price | 630,000 | 630,000 | 10.53% |
| Average Price | 660,087 | 653,120 | 10.44% |
| Average Days on Market | 29 | 16 | -38.46% |
2024 Greater Calgary Regional Market Statistics
City Centre Calgary November 2024 Statistics
| Nov-24 | YTD* | Y/Y% † | |
|---|---|---|---|
| Sales | 357 | 5,723 | 0.39% |
| New Listings | 488 | 8,698 | 6.74% |
| Inventory | 1,134 | 1,098 | 0.46% |
| Sales To New Listings Ratio | 73.16% | 65.80% | -5.95% |
| Benchmark Price | 595,200 | 603,481 | 3.46% |
| Median Price | 522,500 | 448,000 | 7.43% |
| Average Price | 639,739 | 618,853 | 9.84% |
| Average Days on Market | 42 | 29 | -14.71% |
North Calgary November 2024 Statistics
| Nov-24 | YTD* | Y/Y% † | |
|---|---|---|---|
| Sales | 217 | 2,860 | -6.51% |
| New Listings | 308 | 4,201 | 14.81% |
| Inventory | 585 | 409 | 50.92% |
| Sales To New Listings Ratio | 70.45% | 68.08% | -18.56% |
| Benchmark Price | 557,700 | 567,127 | 7.98% |
| Median Price | 550,000 | 570,000 | 14.00% |
| Average Price | 550,263 | 568,782 | 12.57% |
| Average Days on Market | 40 | 23 | 9.52% |
Northeast Calgary November 2024 Statistics
| Nov-24 | YTD* | Y/Y% † | |
|---|---|---|---|
| Sales | 199 | 3,076 | -9.21% |
| New Listings | 359 | 4,759 | 12.77% |
| Inventory | 718 | 505 | 29.82% |
| Sales To New Listings Ratio | 55.43% | 64.64% | -19.48% |
| Benchmark Price | 513,600 | 520,218 | 13.11% |
| Median Price | 525,000 | 526,000 | 17.54% |
| Average Price | 517,069 | 517,594 | 15.47% |
| Average Days on Market | 36 | 27 | 0.00% |
East Calgary November 2024 Statistics
| Nov-24 | YTD* | Y/Y% † | |
|---|---|---|---|
| Sales | 48 | 816 | -0.61% |
| New Listings | 63 | 1,083 | 13.88% |
| Inventory | 113 | 89 | 12.66% |
| Sales To New Listings Ratio | 76.19% | 75.35% | -12.72% |
| Benchmark Price | 438,600 | 435,845 | 18.23% |
| Median Price | 477,500 | 450,000 | 18.42% |
| Average Price | 445,488 | 428,440 | 19.13% |
| Average Days on Market | 35 | 20 | -9.09% |
Southeast Calgary November 2024 Statistics
| Nov-24 | YTD* | Y/Y% † | |
|---|---|---|---|
| Sales | 251 | 3,270 | 2.22% |
| New Listings | 312 | 4,272 | 14.41% |
| Inventory | 483 | 382 | 27.33% |
| Sales To New Listings Ratio | 80.45% | 76.54% | -10.66% |
| Benchmark Price | 577,400 | 583,590 | 8.10% |
| Median Price | 569,700 | 572,000 | 11.07% |
| Average Price | 598,304 | 591,652 | 10.53% |
| Average Days on Market | 32 | 22 | -4.35% |
South Calgary November 2024 Statistics
| Nov-24 | YTD* | Y/Y% † | |
|---|---|---|---|
| Sales | 329 | 4,534 | -0.24% |
| New Listings | 401 | 5,903 | 9.25% |
| Inventory | 634 | 510 | 19.44% |
| Sales To New Listings Ratio | 82.04% | 76.81% | -8.69% |
| Benchmark Price | 580,100 | 584,172 | 9.02% |
| Median Price | 595,000 | 597,700 | 13.85% |
| Average Price | 625,031 | 605,034 | 14.79% |
| Average Days on Market | 32 | 22 | 0.00% |
West Calgary November 2024 Statistics
| Nov-24 | YTD* | Y/Y% † | |
|---|---|---|---|
| Sales | 181 | 2,511 | 1.91% |
| New Listings | 198 | 3,350 | 6.65% |
| Inventory | 330 | 310 | 2.99% |
| Sales To New Listings Ratio | 91.41% | 74.96% | -4.45% |
| Benchmark Price | 715,200 | 716,881 | 7.93% |
| Median Price | 700,000 | 703,000 | 13.30% |
| Average Price | 742,273 | 757,092 | 12.67% |
| Average Days on Market | 34 | 23 | 0.00% |
Northwest Calgary November 2024 Statistics
| Nov-24 | YTD* | Y/Y% † | |
|---|---|---|---|
| Sales | 209 | 2,765 | -1.25% |
| New Listings | 188 | 3,621 | 7.32% |
| Inventory | 340 | 325 | 15.25% |
| Sales To New Listings Ratio | 111.17% | 76.36% | -7.99% |
| Benchmark Price | 635,500 | 647,254 | 8.81% |
| Median Price | 680,000 | 660,000 | 10.00% |
| Average Price | 669,131 | 654,295 | 10.30% |
| Average Days on Market | 35 | 22 | -4.35% |
Airdrie Real Estate November 2024 Statistics
| Nov-24 | YTD* | Y/Y% † | |
|---|---|---|---|
| Sales | 126 | 1,850 | 5.23% |
| New Listings | 175 | 2,501 | 17.75% |
| Inventory | 345 | 249 | 32.45% |
| Sales To New Listings Ratio | 72.00% | 73.97% | -10.63% |
| Benchmark Price | 543,300 | 544,090 | 8.26% |
| Median Price | 539,000 | 549,900 | 12.74% |
| Average Price | 550,077 | 544,323 | 9.97% |
| Average Days on Market | 41 | 25 | 0.00% |
Calgary Detached Homes November 2024 Statistics
| Nov-24 | YTD* | Y/Y% † | |
|---|---|---|---|
| Sales | 865 | 11,804 | -2.62% |
| New Listings | 1,044 | 16,699 | 5.86% |
| Inventory | 1,869 | 1,661 | 8.85% |
| Sales To New Listings Ratio | 82.85% | 70.69% | -8.02% |
| Benchmark Price | 750,100 | 748,790 | 11.13% |
| Median Price | 710,000 | 715,000 | 10.85% |
| Average Price | 785,414 | 802,897 | 11.65% |
| Average Days on Market | 34 | 24 | -4.00% |
Calgary Semi-Detached Homes November 2024 Statistics
| Nov-24 | YTD* | Y/Y% † | |
|---|---|---|---|
| Sales | 173 | 2,232 | 4.64% |
| New Listings | 226 | 3,038 | 14.34% |
| Inventory | 367 | 294 | 10.53% |
| Sales To New Listings Ratio | 76.55% | 73.47% | -8.48% |
| Benchmark Price | 675,100 | 668,263 | 11.18% |
| Median Price | 635,000 | 610,000 | 12.55% |
| Average Price | 702,428 | 684,645 | 13.33% |
| Average Days on Market | 31 | 23 | -11.54% |
Calgary Row Home November 2024 Statistics
| Nov-24 | YTD* | Y/Y% † | |
|---|---|---|---|
| Sales | 330 | 4,419 | 2.62% |
| New Listings | 405 | 5,857 | 17.37% |
| Inventory | 659 | 510 | 32.47% |
| Sales To New Listings Ratio | 81.48% | 75.45% | -12.56% |
| Benchmark Price | 454,300 | 452,881 | 14.95% |
| Median Price | 449,000 | 455,000 | 15.19% |
| Average Price | 465,891 | 468,150 | 15.19% |
| Average Days on Market | 35 | 22 | 0.00% |
Calgary Condominium November 2024 Statistics
| Nov-24 | YTD* | Y/Y% † | |
|---|---|---|---|
| Sales | 429 | 7,211 | -3.63% |
| New Listings | 654 | 10,482 | 12.14% |
| Inventory | 1,485 | 1,198 | 20.77% |
| Sales To New Listings Ratio | 65.60% | 68.79% | -14.08% |
| Benchmark Price | 337,800 | 336,527 | 15.80% |
| Median Price | 325,000 | 324,900 | 16.04% |
| Average Price | 353,733 | 348,053 | 13.77% |
| Average Days on Market | 44 | 27 | -6.90% |
*Year-To-Date as of December 3, 2024
†Year-To-Date, year over year percent change. ‡Calgary Census Metropolitan Area includes Calgary, Airdrie, and Rocky View
Leave A Comment