September 2023 Calgary Real Estate Statistics Recap
Are you ready for some interesting Calgary real estate statistics?! We've got the inside scoop on what's happening in the market in September 2023, and you won't want to miss it! Whether you're a seasoned buyer or a first-time seller, these stats are a must-read for anyone interested in the Calgary real estate scene.
So, what's the current state of the Calgary real estate market? Are home prices skyrocketing, or are they more affordable than ever? How many new listings are hitting the market, and is now a good time to buy or sell? We've got all the answers and more, so buckle up and get ready for a wild ride through the Calgary real estate market.
From stunning homes in the heart of the city to sprawling estates in the suburbs, the Calgary real estate market has something for everyone with our expert analysis and in-depth statistics, you'll be able to navigate the market with ease and confidence.
So, what are you waiting for? Dive into our blog on Calgary Real Estate Statistics for September 2023, and discover the latest trends, insights, and insider information that will give you a competitive edge in the market.
-
Latest Combined Calgary Real Estate Statistics: September 2023
Latest Combined Calgary Real Estate Statistics: September 2023
- Benchmark Price $570,300
- Inventory 3,369
- Sales to New Listings Ratio 76%
- Months of Inventory/Supply 1.38 Months of supply (Down 41% Y/Y)
Year to Date Calgary Real Estate Statistics: September 2023
- Benchmark Price $552,144
- Sales to New Listings Ratio 79%
- Months of Inventory/Supply 1.29 Months of supply (Down 21% Y/Y)
DOM = Number of Days on Market
As of September 6th 2023, the average number of days on market for all property types combined was 26 days (YTD) while the month of September saw an average DOM of 25
MLS® Listings in Calgary (New)
As of September 6th 2023, the total number of new active listings in the city of Calgary added to the market was 3,394 and in total there have been 28,634 YTD
Homes Sold in Calgary August 2023
The total number of homes sold for the month of September in Calgary was 2,411 this represents a 28.88% increase Y/Y. The total sales for 2023 are 22,689 which represents a 10.93% decrease Y/Y.
Average Real Estate Prices in Calgary
In September 2023 the average price for a detached home in the city of Calgary was $549,668
Specific community spotlight real estate statistics
Kingsland Park Detached Homes Statistics
| Sep-23 | YTD* | Y/Y% † | |
|---|---|---|---|
| Sales | 7 | 52 | -32.47% |
| New Listings | 11 | 71 | -36.04% |
| Inventory | 9 | 8 | -50.00% |
| Sales To New Listings Ratio | 63.64% | 73.24% | 5.58% |
| Benchmark Price | 481,700 | 476,155 | 0.33% |
| Median Price | 247,500 | 500,000 | 3.54% |
| Average Price | 367,414 | 463,862 | 5.24% |
| Average Days on Market | 14 | 30 | 0.00% |
Mckenzie Lake Detached Homes Statistics
| Sep-23 | YTD* | Y/Y% † | |
|---|---|---|---|
| Sales | 14 | 139 | -23.20% |
| New Listings | 14 | 158 | -26.85% |
| Inventory | 9 | 10 | -37.50% |
| Sales To New Listings Ratio | 100.00% | 87.97% | 4.98% |
| Benchmark Price | 667,300 | 637,455 | 6.06% |
| Median Price | 658,250 | 586,500 | 11.71% |
| Average Price | 692,206 | 650,629 | 9.22% |
| Average Days on Market | 24 | 17 | 6.25% |
Springbank Hill Detached Homes Statistics
| Sep-23 | YTD* | Y/Y% † | |
|---|---|---|---|
| Sales | 11 | 149 | -26.96% |
| New Listings | 25 | 224 | -19.13% |
| Inventory | 29 | 29 | -21.62% |
| Sales To New Listings Ratio | 44.00% | 66.52% | -9.68% |
| Benchmark Price | 872,800 | 819,511 | 6.44% |
| Median Price | 1,070,000 | 920,000 | 15.58% |
| Average Price | 1,112,773 | 965,359 | 7.51% |
| Average Days on Market | 44 | 23 | -17.86% |
Lake Bonavista Detached Homes Statistics
| Sep-23 | YTD* | Y/Y% † | |
|---|---|---|---|
| Sales | 10 | 176 | 4.76% |
| New Listings | 21 | 213 | 0.95% |
| Inventory | 22 | 19 | -26.92% |
| Sales To New Listings Ratio | 47.62% | 82.63% | 3.78% |
| Benchmark Price | 716,700 | 716,755 | 2.04% |
| Median Price | 772,500 | 662,500 | -3.25% |
| Average Price | 769,275 | 656,326 | -1.28% |
| Average Days on Market | 32 | 23 | -14.81% |
Tuxedo Park Detached Homes Statistics
| Sep-23 | YTD* | Y/Y% † | |
|---|---|---|---|
| Sales | 13 | 108 | -6.90% |
| New Listings | 23 | 157 | -18.23% |
| Inventory | 23 | 23 | -39.47% |
| Sales To New Listings Ratio | 56.52% | 68.79% | 13.85% |
| Benchmark Price | 602,600 | 580,222 | 5.78% |
| Median Price | 543,900 | 544,450 | -6.13% |
| Average Price | 545,414 | 579,513 | -2.15% |
| Average Days on Market | 13 | 31 | -11.43% |
2023 Greater Calgary Regional Market Statistics
City Centre Calgary Statistics
| Sep-23 | YTD* | Y/Y% † | |
|---|---|---|---|
| Sales | 521 | 4,832 | 9.12% |
| New Listings | 824 | 6,944 | -2.81% |
| Inventory | 1,126 | 1,107 | -20.70% |
| Sales To New Listings Ratio | 63.23% | 69.59% | 12.30% |
| Benchmark Price | 597,300 | 588,044 | 1.50% |
| Median Price | 418,500 | 420,000 | -11.52% |
| Average Price | 590,385 | 563,058 | -2.35% |
| Average Days on Market | 32 | 34 | -15.00% |
North Calgary Statistics
| Sep-23 | YTD* | Y/Y% † | |
|---|---|---|---|
| Sales | 278 | 2,592 | -22.77% |
| New Listings | 356 | 3,096 | -27.17% |
| Inventory | 321 | 268 | -36.79% |
| Sales To New Listings Ratio | 78.09% | 83.72% | 6.04% |
| Benchmark Price | 545,400 | 523,777 | 5.16% |
| Median Price | 510,000 | 499,300 | 3.80% |
| Average Price | 518,868 | 502,721 | 2.12% |
| Average Days on Market | 21 | 20 | -9.09% |
Northeast Calgary Statistics
| Sep-23 | YTD* | Y/Y% † | |
|---|---|---|---|
| Sales | 351 | 2,843 | -8.73% |
| New Listings | 393 | 3,490 | -27.98% |
| Inventory | 398 | 384 | -45.61% |
| Sales To New Listings Ratio | 89.31% | 81.46% | 26.73% |
| Benchmark Price | 482,100 | 455,566 | 8.12% |
| Median Price | 484,000 | 445,000 | 9.88% |
| Average Price | 470,468 | 446,897 | 7.68% |
| Average Days on Market | 25 | 27 | -6.90% |
East Calgary Statistics
| Sep-23 | YTD* | Y/Y% † | |
|---|---|---|---|
| Sales | 100 | 688 | -14.00% |
| New Listings | 103 | 800 | -22.85% |
| Inventory | 82 | 80 | -44.83% |
| Sales To New Listings Ratio | 97.09% | 86.00% | 11.47% |
| Benchmark Price | 393,300 | 368,366 | 11.85% |
| Median Price | 407,500 | 375,000 | 10.29% |
| Average Price | 370,222 | 355,513 | 10.79% |
| Average Days on Market | 23 | 23 | -25.81% |
Southeast Calgary Statistics
| Sep-23 | YTD* | Y/Y% † | |
|---|---|---|---|
| Sales | 285 | 2,728 | -22.43% |
| New Listings | 349 | 3,185 | -26.12% |
| Inventory | 320 | 296 | -26.55% |
| Sales To New Listings Ratio | 81.66% | 85.65% | 4.99% |
| Benchmark Price | 562,500 | 539,888 | 4.39% |
| Median Price | 529,900 | 515,000 | 6.05% |
| Average Price | 547,112 | 534,853 | 5.14% |
| Average Days on Market | 22 | 22 | 4.76% |
South Calgary Statistics
| Sep-23 | YTD* | Y/Y% † | |
|---|---|---|---|
| Sales | 454 | 3,857 | -12.00% |
| New Listings | 536 | 4,622 | -16.98% |
| Inventory | 490 | 428 | -27.58% |
| Sales To New Listings Ratio | 84.70% | 83.45% | 6.00% |
| Benchmark Price | 553,400 | 536,922 | 4.74% |
| Median Price | 535,750 | 525,000 | 5.00% |
| Average Price | 537,387 | 527,420 | 5.43% |
| Average Days on Market | 24 | 22 | -4.35% |
West Calgary Statistics
| Sep-23 | YTD* | Y/Y% † | |
|---|---|---|---|
| Sales | 199 | 2,121 | -15.77% |
| New Listings | 283 | 2,711 | -15.02% |
| Inventory | 312 | 305 | -25.06% |
| Sales To New Listings Ratio | 70.32% | 78.24% | -0.87% |
| Benchmark Price | 685,300 | 666,055 | 4.41% |
| Median Price | 650,000 | 620,000 | 0.32% |
| Average Price | 684,377 | 669,987 | 2.66% |
| Average Days on Market | 23 | 23 | -20.69% |
Northwest Calgary Statistics
| Sep-23 | YTD* | Y/Y% † | |
|---|---|---|---|
| Sales | 249 | 2,393 | -15.14% |
| New Listings | 334 | 2,908 | -20.65% |
| Inventory | 307 | 285 | -33.87% |
| Sales To New Listings Ratio | 74.55% | 82.29% | 6.95% |
| Benchmark Price | 611,900 | 594,022 | 5.37% |
| Median Price | 612,500 | 595,000 | 6.25% |
| Average Price | 599,700 | 591,379 | 5.21% |
| Average Days on Market | 22 | 23 | -4.17% |
Airdrie Real Estate Statistics
| Sep-23 | YTD* | Y/Y% † | |
|---|---|---|---|
| Sales | 144 | 1,496 | -29.63% |
| New Listings | 204 | 1,811 | -30.00% |
| Inventory | 199 | 185 | -22.27% |
| Sales To New Listings Ratio | 70.59% | 82.61% | 0.52% |
| Benchmark Price | 518,000 | 500,877 | 2.99% |
| Median Price | 496,450 | 487,750 | 1.61% |
| Average Price | 509,361 | 494,547 | 3.95% |
| Average Days on Market | 24 | 25 | 31.58% |
Calgary Detached Homes Statistics
| Sep-23 | YTD* | Y/Y% † | |
|---|---|---|---|
| Sales | 1,147 | 10,342 | -22.92% |
| New Listings | 1,518 | 13,475 | -27.96% |
| Inventory | 1,677 | 1,523 | -30.46% |
| Sales To New Listings Ratio | 75.56% | 76.75% | 7.00% |
| Benchmark Price | 696,100 | 668,322 | 5.99% |
| Median Price | 650,000 | 645,000 | 7.67% |
| Average Price | 729,889 | 718,271 | 9.07% |
| Average Days on Market | 25 | 24 | 9.09% |
Calgary Semi-Detached Homes Statistics
| Sep-23 | YTD* | Y/Y% † | |
|---|---|---|---|
| Sales | 191 | 1,817 | -14.49% |
| New Listings | 277 | 2,239 | -22.34% |
| Inventory | 296 | 261 | -29.84% |
| Sales To New Listings Ratio | 68.95% | 81.15% | 10.09% |
| Benchmark Price | 621,300 | 597,188 | 5.73% |
| Median Price | 542,000 | 540,000 | 9.09% |
| Average Price | 601,147 | 600,888 | 9.39% |
| Average Days on Market | 25 | 26 | 0.00% |
Calgary Row Home Statistics
| Sep-23 | YTD* | Y/Y% † | |
|---|---|---|---|
| Sales | 397 | 3,664 | -16.63% |
| New Listings | 472 | 4,200 | -22.58% |
| Inventory | 389 | 383 | -41.53% |
| Sales To New Listings Ratio | 84.11% | 87.24% | 7.69% |
| Benchmark Price | 419,400 | 389,855 | 11.36% |
| Median Price | 409,900 | 390,000 | 12.07% |
| Average Price | 419,367 | 404,120 | 13.26% |
| Average Days on Market | 20 | 22 | -21.43% |
Calgary Condominium Statistics
| Sep-23 | YTD* | Y/Y% † | |
|---|---|---|---|
| Sales | 191 | 1,817 | -14.49% |
| New Listings | 277 | 2,239 | -22.34% |
| Inventory | 296 | 261 | -29.84% |
| Sales To New Listings Ratio | 68.95% | 81.15% | 10.09% |
| Benchmark Price | 621,300 | 597,188 | 5.73% |
| Median Price | 542,000 | 540,000 | 9.09% |
| Average Price | 601,147 | 600,888 | 9.39% |
| Average Days on Market | 25 | 26 | 0.00% |
*Year-To-Date as of October 6th, 2023
†Year-To-Date, year over year percent change.‡Calgary Census Metropolitan Area includes Calgary, Airdrie, and Rocky View
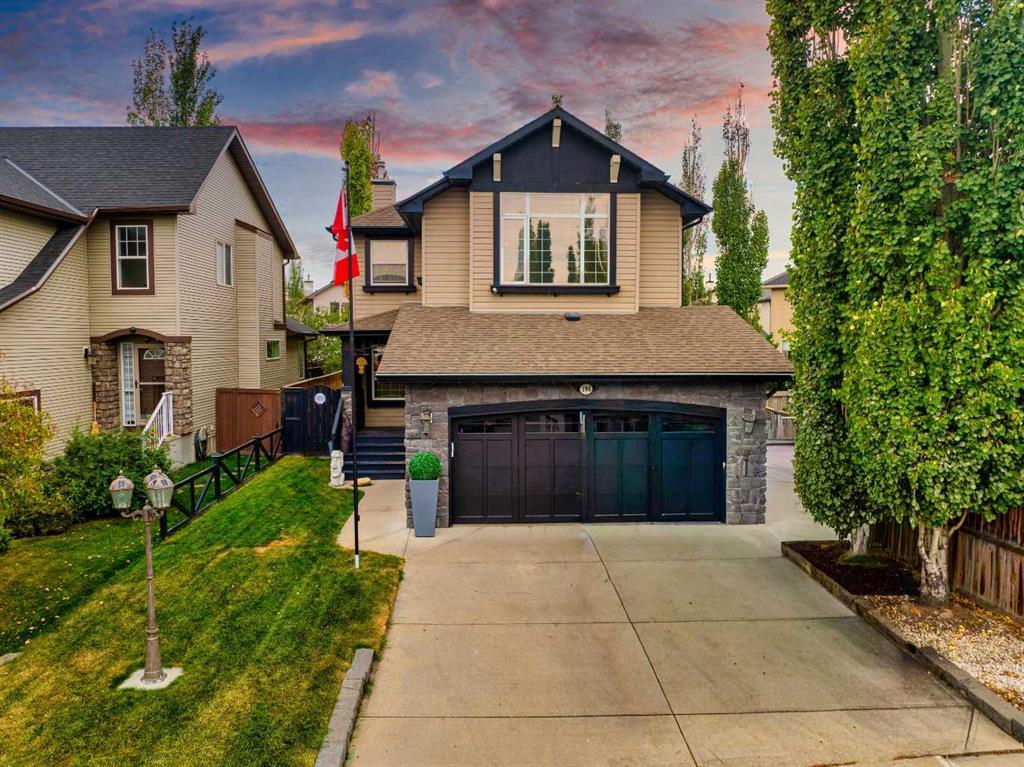
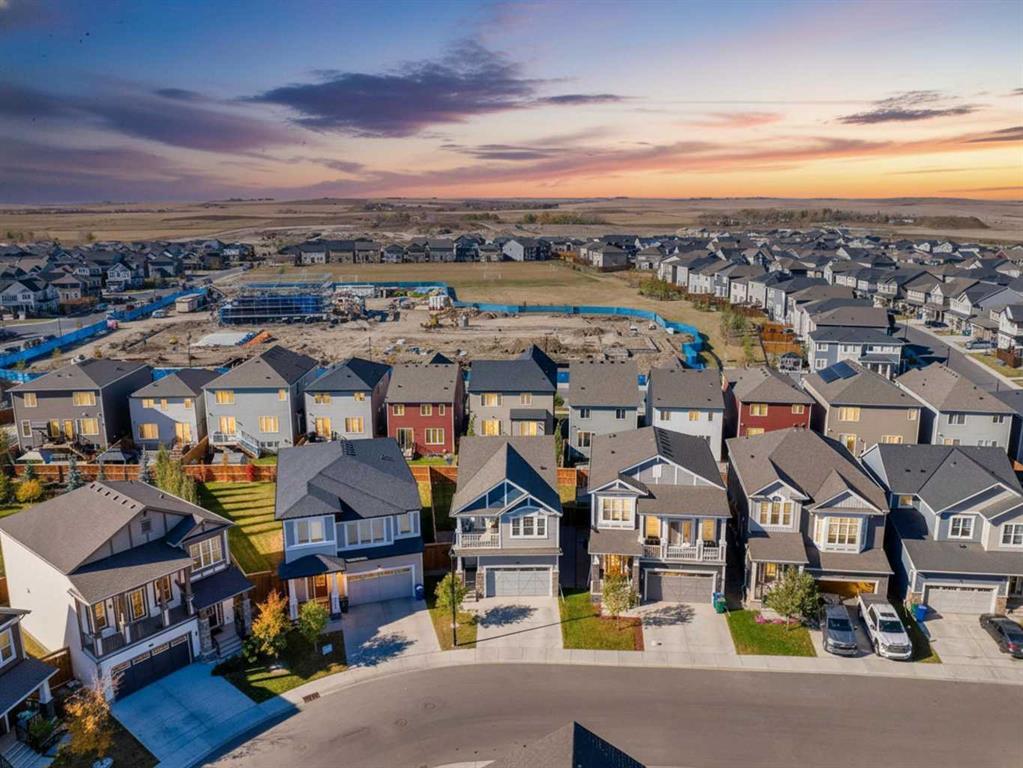
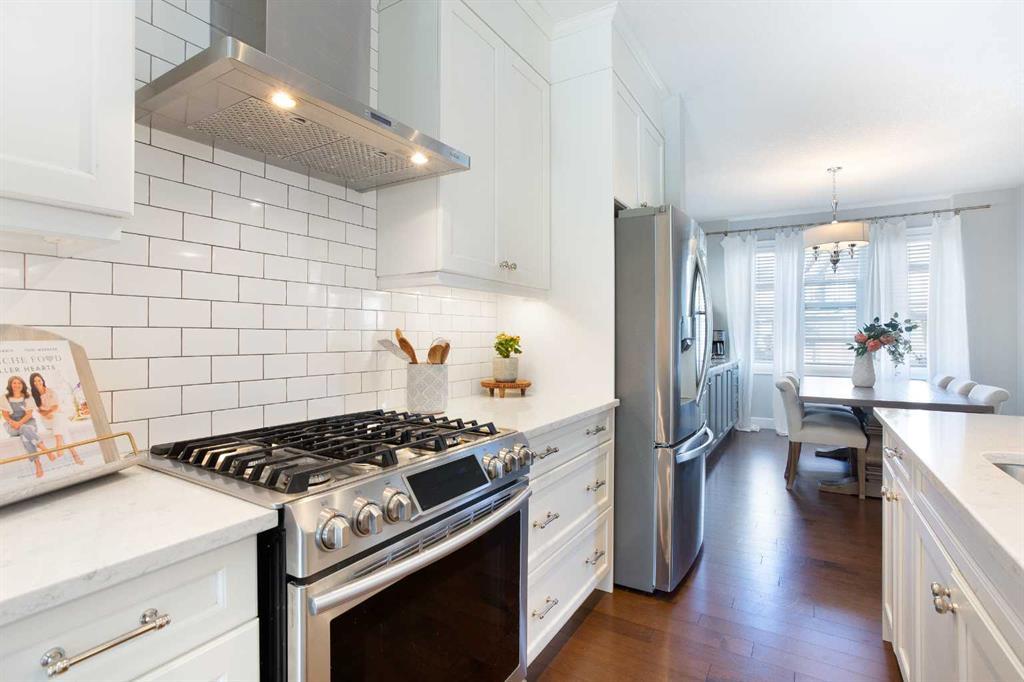
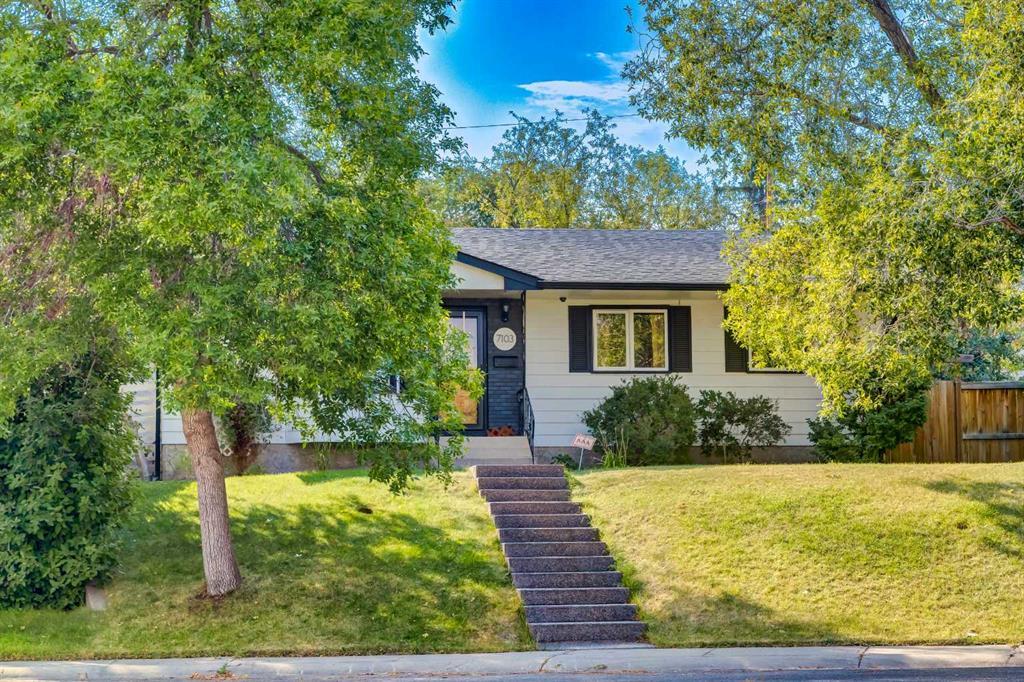
Our Featured Listings
- All Listings
- $100,000 - $200,000
- $200,000 - $300,000
- $300,000 - $400,000
- $400,000 - $500,000
- $500,000 - $600,000
- $600,000 - $700,000
- $700,000 - $800,000
- $800,000 - $900,000
- $900,000 - $1,000,000
- Over $1,000,000
Free Calgary Real Estate Monthly Market Report
If you're looking for the latest sales and statistics for your community in Calgary or one that you're interested in moving to, please fill out the form below and let us know which community you need a monthly market report set up for.








Leave A Comment